SUMMARY
The outlook for arctic sea ice for September 2009, based on June data, indicates a continuation of low pan-arctic sea ice extent and no indication that a return to historical levels will occur.
The July Sea Ice Outlook Report is based on a synthesis of 16 individual pan-arctic estimates (plus nine regional contributions) utilizing a range of methods.
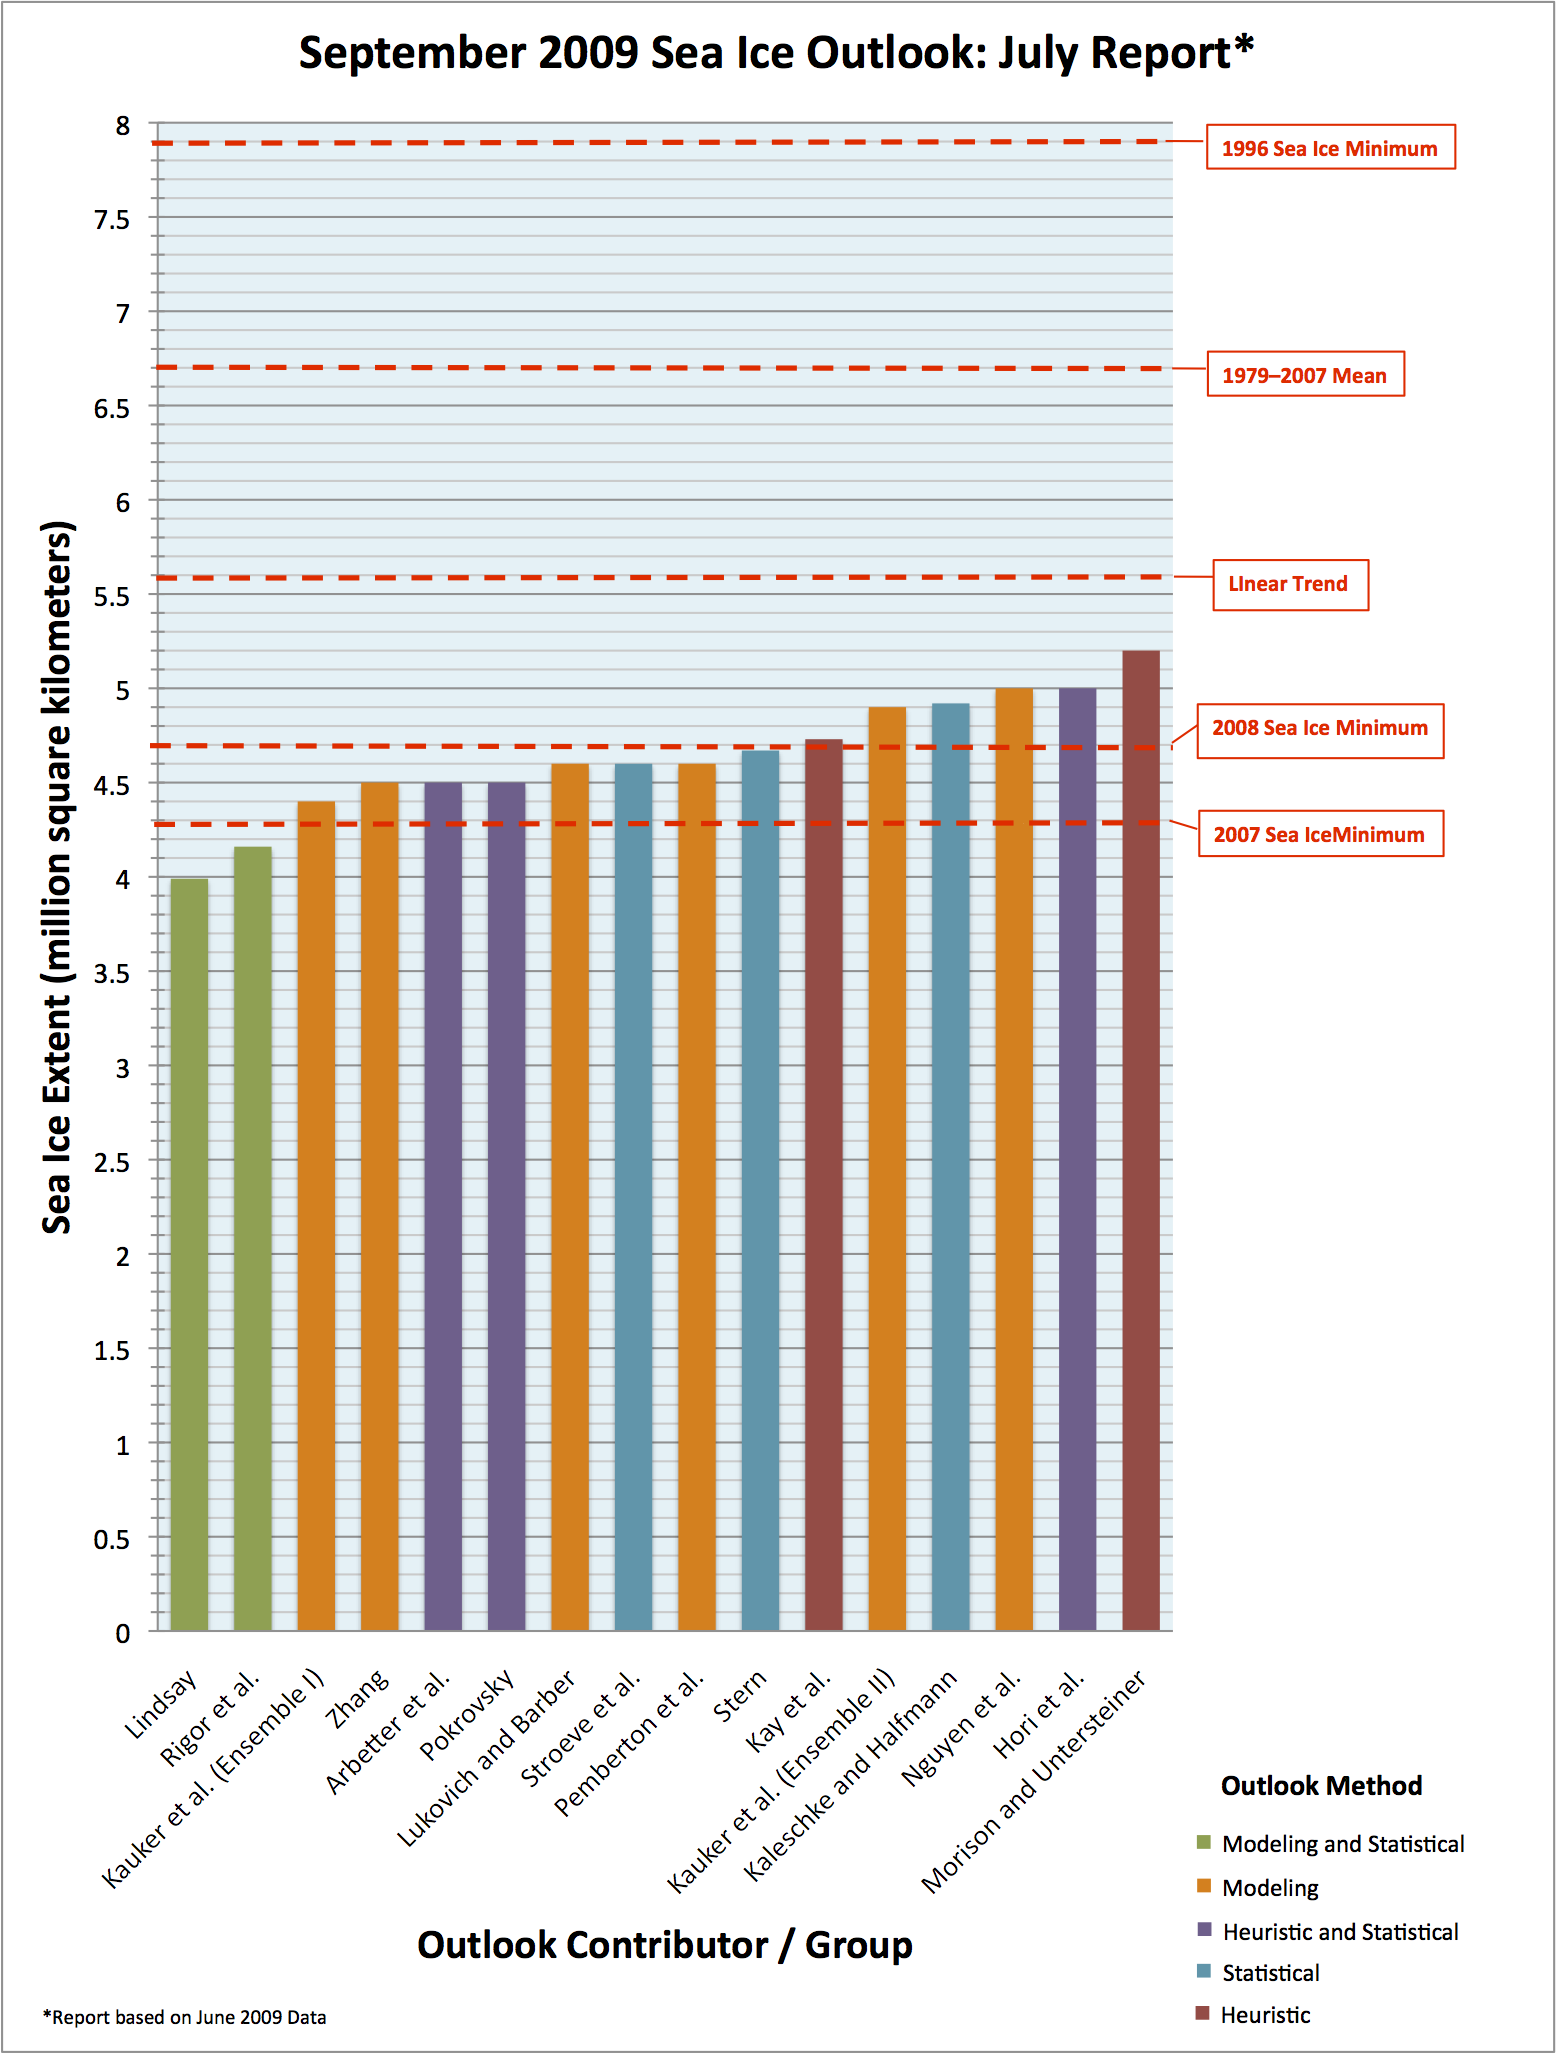
The range of individual outlook values this month is from 4.0 to 5.2 million square kilometers, with most of the estimates in a narrow range of 4.4 to 5.2 million square kilometers. The two lowest estimates, 4.0 and 4.2 million square kilometers, would represent a new record minimum. All estimates are well below the 1979–2007 September climatological mean value of 6.7 million square kilometers. The uncertainty / error values, from those groups that provided them, are about 0.4 million square kilometers, thus many of the values essentially overlap.
Although the majority of the responses indicate either persistent conditions or a slight increase over the 2008 sea ice extent, there appears to be about a 20% chance of reaching a new minimum in 2009. The September 2009 extent, as we track it for the rest of the summer, will depend on several factors, including the dynamics of the relatively high levels of thin, first year ice; temperature and wind conditions; and sea level pressure.
FULL REPORT
Results
We would like to welcome five new groups to the 2009 Outlook. We received 15 responses for the September Outlook based on June data (Figure 1). Most estimates for September sea ice extent are in a narrow range of 4.4 to 5.2 million square kilometers, as were last month's (based on May data). However, two new responses come in at 4.0 and 4.2 million square kilometers, which would represent a new record minimum. As the submitted uncertainty standard deviations are about 0.4 million square kilometers, most of the Outlook estimates overlap. All Outlook sea ice extent estimates for September 2009 are much lower than the past climatological extent of 6.7 million square kilometers. Although there is general consensus in the September Outlook for either persistent conditions or a slight increase over the 2008 sea ice extent, Outlook contributions which provide probabilistic assessments indicate about a 20% chance of reaching a new September sea ice minimum in 2009.
Qualitatively, the June and early July sea ice data suggest a "bimodal" Outlook. Multi-year sea ice has been reduced to such low levels that the overall September sea ice extent is largely tied to the fate of the first-year sea ice, which appears thin or with low concentrations away from the central Arctic (see AMSR satellite data and the calculations by Lindsay and Rigor). Depending on August conditions, much of this first-year sea ice could either melt out by September or survive the summer as a vast expanse of thin sea ice.

Assessment of Extremes in September Extent
While we are asking for expected values of the ice extent for September, most researchers recognize that any quantitative outlook should ideally include a probabilistic approach. This summer, most Outlooks indicate a persistence of conditions from 2008, placing the September 2009 sea ice extent close to the value of 2008. At the same time, the probability of a new record minimum extent is also of interest and significance according to some contributors. Estimates of the standard deviation of Outlook values for September 2009 run at 0.3, 0.4, 0.4, 0.5, and 0.5 million square kilometers. Applying these standard deviations to the consensus Outlook value of 4.6 million square kilometers, there is about a 16% chance that the estimate could be near the 2007 record value and about a 40% chance of there being sea ice greater than the 2008 value. There is virtually no chance of returning to previous 1990s sea ice conditions.
The modeling groups often run their predictions starting with spring 2009 sea ice conditions and a range of potential summer 2009 weather conditions supplied from previous years (called ensemble members). Based on this approach, the AWI group says that there is either a 5% or 36% chance (depending on which method is employed) that the September 2009 sea ice will be below the 2007 extent and thus set a new record. The SMHI group finds a 28% chance of setting a new record minimum sea ice extent and Zhang states that there is a 2 in 9 (22%) chance of setting a new record. The NIC group has what they call an "aggressive" projection, which decreased from a value of 3.2 million square kilometers based on May data to a value of 2.9 million square kilometers based on June data. Further, 2 of the 16 (13%) Outlook estimates suggest the possibility of new record sea ice extent minimum. Taken together, these multiple approaches imply about a 20% chance of setting a new record in September 2009.
Climate Data for June 2009 and Weather Outlook for July
The NSIDC sea ice extent chart for 5 July (Figure 2) shows less than median sea ice extents north of Alaska, in the Barents Sea, and in Baffin Bay. The AMSR-E image for 5 July (http://www.iup.uni-bremen.de:8084/amsr/amsre.html) is similar in extent and also shows lower ice concentrations in the Canadian Beaufort Sea and north along 130° E. The time history of extent (NSIDC, Figure 3) indicates that there was a rapid decrease in area during May to a value near the 2007 trajectory in early June, but without a repeat of the rapid loss in 2007 at the end of June. The ice mass buoys (Perovich) recorded some bottom melt at the southern most sites in the Beaufort Sea. The buoys and the web camera at the North Pole Environmental Observatory site (Morison) showed a late beginning of snow melt at the end of June (Figure 4).

(Credit: http://nsidc.org/arcticseaicenews/)

(Credit: http://nsidc.org/arcticseaicenews/)
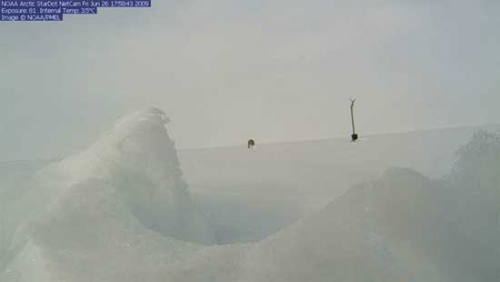
(Credit: http://psc.apl.washington.edu/northpole/)
The air temperature anomalies for June (not shown) have positive values north of Siberia, which continued from May. Eastern Arctic North America was cold. The sea level pressure field for June (Figure 5) shows the "Arctic Dipole" pattern with high pressure north of Alaska and low pressure north of Asia. This pattern is supportive of sea ice loss in the Pacific sector of the Arctic as suggested by the sea ice extent analysis in Figure 2, and has been an important sea ice loss climate pattern since 2005, especially in summer 2007. The 8–14 day 500 mb geopotental heights and anomalies forecast valid for 13–19 July (Figure 6), however, show a rather flat field over the central Arctic with higher pressures north of Greenland and lower pressures near the Aleutian Islands. Another product to keep an eye on is the Climate Prediction Center CFS Forecast of Seasonal Climate Anomalies.
Early June appeared favorable for September sea ice loss given the June sea ice extent and the dipole wind pattern. But the sea ice loss may have slowed down in late June, and the early July wind forecast is for no strong wind patterns that would drive further sea ice melt and export. Summer melt conditions in July are expected to follow climatology. Overall, the Outlook yields mixed signals, with the potential for substantial sea ice loss due to what appears to be a record-low in multiyear sea ice extent compared to the extent of first year sea ice, tempered by cooler conditions less favorable to a massive ice loss than in the past two years. This is reflected in how sea ice melt played out so far at the local level, such as in northern Alaska. There, an uncommon balance between factors favoring early ice break-up and cool, cloudy weather have resulted in a lingering ice cover in advanced state of decay.

(Credit: http://www.cdc.noaa.gov/cgi-bin/data/composites/comp.pl)
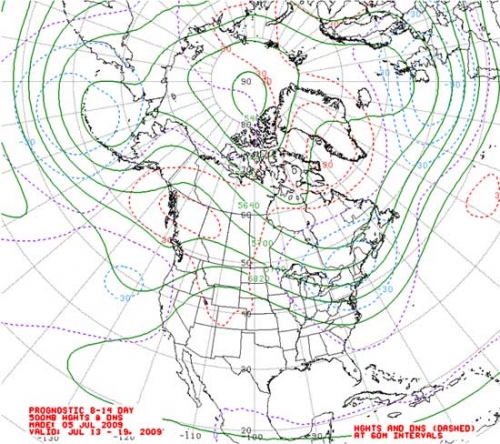
(Credit: http://www.cpc.ncep.noaa.gov/products/predictions/610day/500mb.php)
Key Statements from Individual Outlooks
(Name; estimate in million square kilometers; and method)
Ordered from lowest to highest
Lindsay; 4.0 million square kilometers; Model
The predicted mean ice extent in September is 3.99 +/- 0.30 million square kilometers, a record low, and it is based on the fractional area of ice and open water less than 0.4 m thick (G0.4) obtained from model retrospective simulations. This prediction is substantially lower than that from May data (4.98 ± 0.50, based on G1.9). The anomalous thin ice in the Beaufort Sea is most influential in making the prediction, but widespread anomalies in this measure contribute, including an area in the Barents Sea.
Rigor et al.; 4.2 million square kilometers; Statistical—age estimates
In comparison to 2007 and 2008, there is much more first year (FY) ice in the Beaufort and Chukchi Seas in 2009, which we expect to precondition this area for a more extensive retreat than in 2007 and 2008. The age of sea ice in the Transpolar Drift Stream is also younger in the areas north of the East Siberian Sea (~80°N, 150°E), which also preconditions this area for more retreat compared to previous years.
Kauker; Ensemble II= 4.4 million square kilometers, Ensemble I= 4.9 million square kilometers; Model
I find it remarkable that all groups using sea ice/ocean models have slightly higher values in the July outlook compared to the June outlook: our ensemble I was 4.6->4.9, ensemble II 4.2 -> 4.4; Zhang was 4.2 -> 4.5; and Nguyen was 4.9 -> 5.0. I tried to find out why that is the case in our model. I found that we have higher ice thicknesses north of the Laptev Sea in June 2009 compared to June 2008. That might be the reason.
Zhang; 4.5 million square kilometers; Model
The forecast from July 1 is 4.5 million square kilometers, a bit more than the outlook from June 1 (4.2 million square kilometers). But the forcing of June is probably not radically out of ordinary.
Arbetter et al.; 4.5 million square kilometers; Heuristic
Using the most current hemispheric ice chart and ArcGIS, the map is edited to select all parcels with MYI as the primary ice type.
Pokrovsky; 4.5 million square kilometers; Heuristic-statistical
There is no trend in our previous estimate in this part of the Arctic (Chukchi). The SST anomaly in May 2009, which is now available but was not for the previous report, demonstrated a "warm tongue" of the inflow stream directed to the eastern part of the Arctic.
Lukovich and Barber; 4.6 million square kilometers; Heuristic
The absence of a distinctive transition in spring of 2009, between cyclonic and anti-cyclonic circulation in the stratosphere (characteristic of years with record lows in sea ice extent), suggests that dynamical contributions will contribute to but not accelerate the decline in sea ice extent in September 2009. Differences between surface winds and SLP, and vortex splitting and sea ice extent composites exhibit conditions that are unfavorable to export through Fram Strait in May, 2009; southwesterly versus southeasterly winds in the Beaufort Sea region may also limit free ice drift conditions and inhibit the acceleration evident in years exhibiting record lows in sea ice extent.
Stroeve et al.; 4.6 million square kilometers; Statistical
No change from last month's outlook.
Pemberton et al.; 4.6 million square kilometers; Model
We take an ensemble approach with a regional coupled ocean /sea ice model using ECMWF ERA-Interim realizations.
Stern; 4.7 million square kilometers; Least squares fit to data
No change from last month's outlook.
Kay et al.; 4.7 million square kilometers; Heuristic and composite—multiple methods
The discussion has involved both researchers intimately involved in sea ice research, and researchers who have no specific knowledge of sea ice processes but experience in climate research. Discussion this year has focused on the vulnerability of the ice pack due to long-term thinning and the record-low 2007/2008 ice extent minima, the fast pace of the ice loss in May 2009, and on the importance of the unpredictable summer weather conditions.
Kaleschke and Halfmann; 4.9 million square kilometers; Statistical
Our forecast has not changed from last month, but we describe in our report what we would have done differently if we would have recent sea ice concentration data. The work is done by Gregor Halfmann as part of his Bachelor thesis in Oceanography.
Nguyen et al.; 5.0 million square kilometers; Model
Same methodology as last month.
Hori et al.; 5.0 million square kilometers; Heuristic—remote sensing
Basically, there is no change from last month except for an additional rough estimation of the arctic sea-ice albedo.
Morison and Untersteiner; 5.2 million square kilometers; Heuristic
We see several positive signs for extent compared to the last couple of years:
The melt at the North Pole Environmental Observatory seems very late; there is still plenty of snow and zero melt ponds;
Temperatures were cold during the spring deployment and there wasn't too much snow, implying good growth persisted longer than usual;
The extent in the spring was pretty good;
There was more second year ice this last year than in the previous year; and
Polyakov has reported cooler ocean conditions.
Our estimate is based on the same improvement from 2008 to 2009 as occurred going from 2007 to 2008 plus 200,000 square kilometers based on gut feeling. Note: we purposely didn't look at last month's estimates to avoid biasing our estimate.
| Attachment | Size |
|---|---|
| Download All Individual July 2009 Outlook Submissions (PDF - 3.6 MB)3.61 MB | 3.61 MB |
| Attachment | Size |
|---|---|
| Lindsay239.27 KB | 239.27 KB |
| Rigor et al.3.82 MB | 3.82 MB |
| Kauker et al.1.37 MB | 1.37 MB |
| Zhang328.9 KB | 328.9 KB |
| Arbetter et al.947.36 KB | 947.36 KB |
| Pokrovsky225.53 KB | 225.53 KB |
| Lukovich and Barber2.42 MB | 2.42 MB |
| Stroeve et al.128.66 KB | 128.66 KB |
| Pemberton et al.495.91 KB | 495.91 KB |
| Stern81.99 KB | 81.99 KB |
| Kay et al.64.38 KB | 64.38 KB |
| Kaleschke and Halfmann175.59 KB | 175.59 KB |
| Nguyen et al.91.07 KB | 91.07 KB |
| Hori et al.66.54 KB | 66.54 KB |
| Morison and Untersteiner60.22 KB | 60.22 KB |
| Attachment | Size |
|---|---|
| Eicken et al.1.19 MB | 1.19 MB |
| Pokrovsky225.95 KB | 225.95 KB |
| Perovich603.75 KB | 603.75 KB |
| Fowler et al.3.77 MB | 3.77 MB |
| Zhang59.52 KB | 59.52 KB |
| Gudmandsen et al.561.03 KB | 561.03 KB |
| Howell and Duguay532.83 KB | 532.83 KB |
| Gerland and Goodwin678.17 KB | 678.17 KB |
