Outlook Report
Executive Summary
We heartily thank those who contributed to this 2021 August Sea Ice Outlook (SIO) report. This activity thrives only through the dedicated participation of the many forecast contributors. The 2021 August Sea Ice Outlook received 45 submissions (38 in June, 41 in July). These outlook contributions are based on various methods, including dynamical (physics-based) models, statistical approaches, heuristic (qualitative), and machine-learning. Along with projections of total Arctic sea-ice extent for September, the August SIO received nine projections of Antarctic total ice extent (eight in the June SIO and seven in the July SIO) and nine projections of ice extent in the Alaskan sector, which combines the Bering, Chukchi, and Beaufort seas (seven in the June SIO and eight in the July SIO). Sea-ice probability (SIP) forecasts from ten models and eight first ice-free date (IFD) are included in the August 2021 SIO. New in 2021, the SIO solicited September mean Arctic sea-ice extent anomaly forecasts and received 15 in August (14 in the June SIO and 14 in the July SIO).
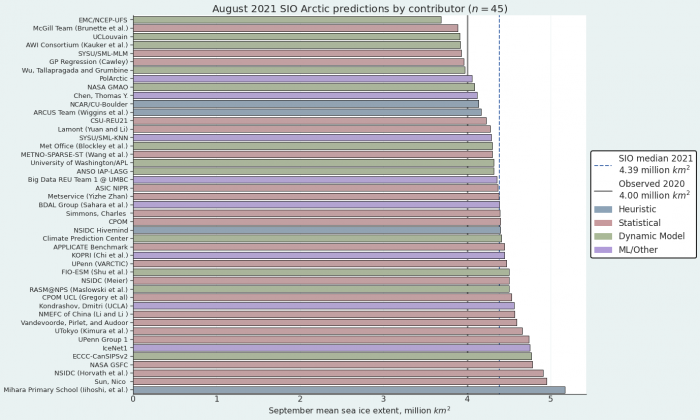
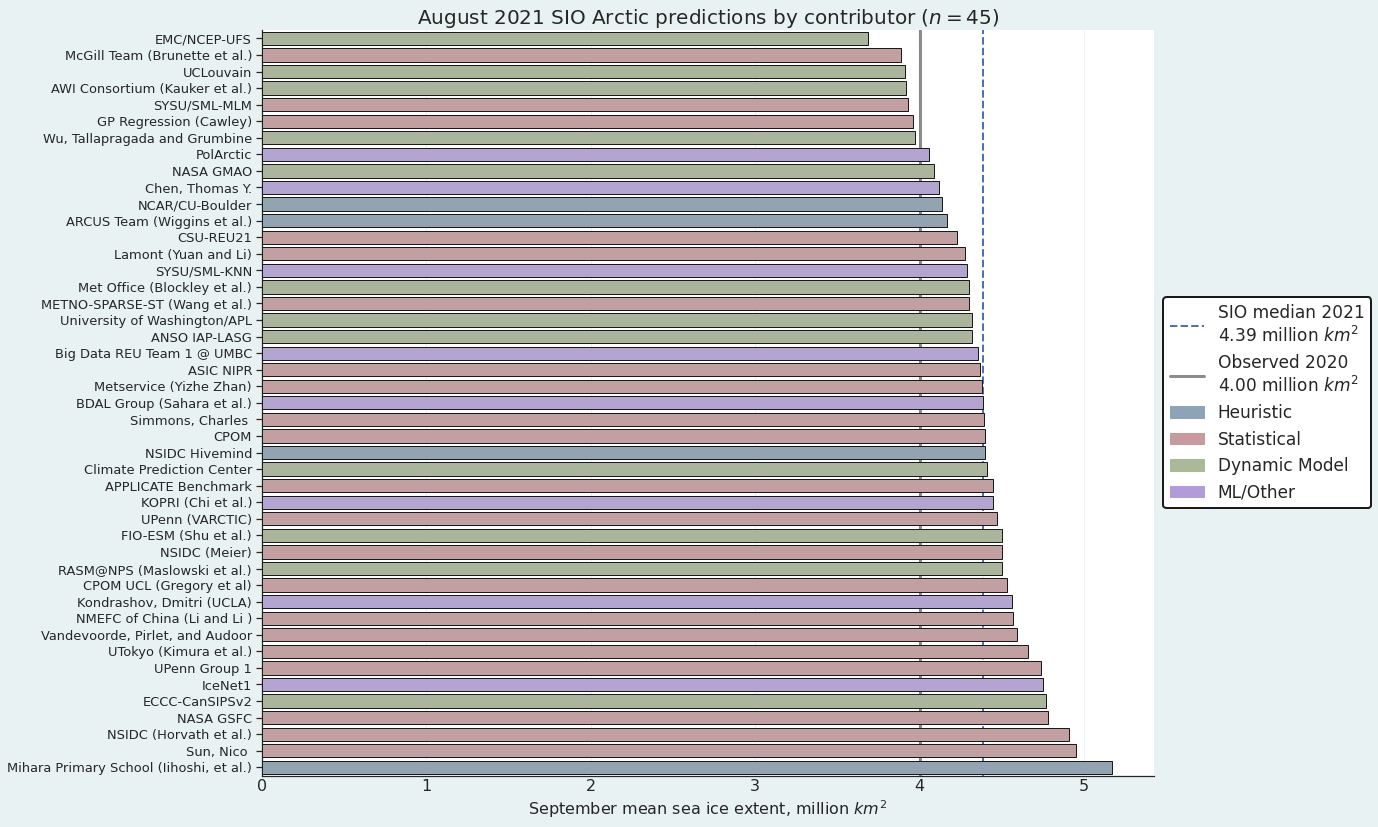
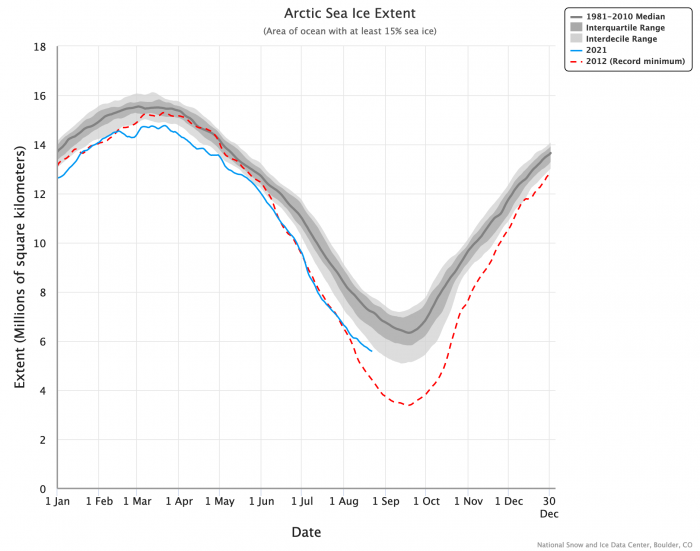
The Pan-Arctic August Outlook median forecast value for September 2021 sea-ice extent is 4.39 million square kilometers, with upper and lower quartile values of 4.1 and 4.5 million square kilometers, respectively. The median of the August submissions is higher than that from July (4.36 million square kilometers) and June (4.37 million square kilometers). Based on the National Snow and Ice Data Center (NSIDC) Sea Ice Index (SII), the Arctic sea-ice extent index is 5.58 million square kilometers, as of 22 August 2021. Arctic sea-ice extent in 2021 remains well below the climatological median and has closely followed the 2012 values for much of the summer (Figure 4) but has diverged to higher sea-ice extent starting in early August. The forecasts continue to support a September 2021 mean sea-ice extent that is well above the September 2020 value.
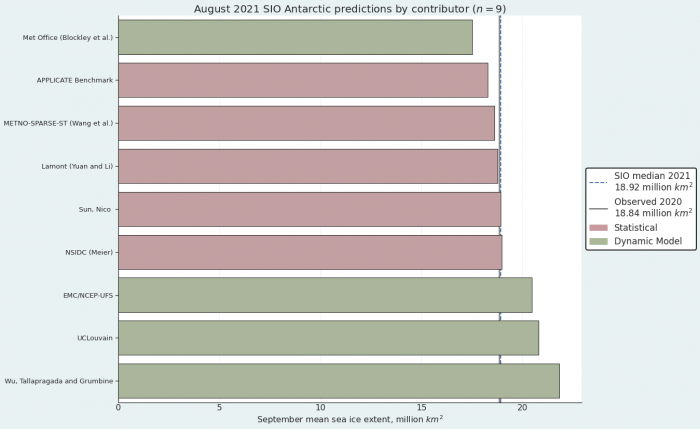
For Antarctica, the bulk of the statistical forecasts were concentrated around the climatological and anomaly persistence forecasts and two dynamical forecasts were outliers. Initial findings from the SIPN South project suggest that forecasts of summer sea-ice concentration from statistical forecasts are more skillful than from dynamical ones. If this holds for winter, then we should expect close-to-average conditions in September.
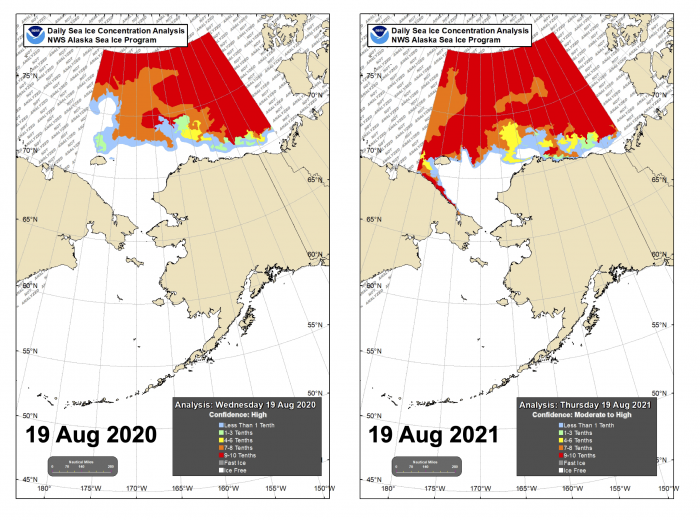
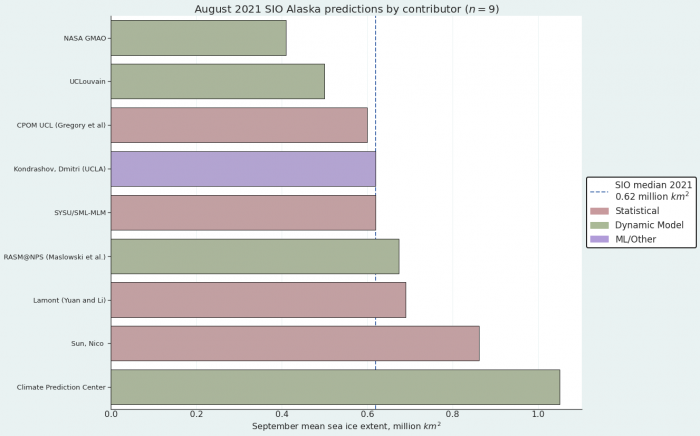
For the Alaskan regional sea-ice extent, a median value of 0.62 million square kilometers was predicted from the nine contributions based on statistical, dynamical, and machine learning/other methods. The August 2021 SIO forecasts continue to predict Alaska sea-ice extent (Bering, Chukchi, and Beaufort seas) greater than the 2007–2020 average of 0.44 million square kilometers. Sea-ice extent observations in the Alaskan seas, as of 19 August 2021, are 1.16 million square kilometers, which is substantially more than the 0.77 million square kilometers from 19 August 2020.
This August Outlook was developed by lead author Uma Bhatt, University of Alaska Fairbanks (Executive Summary, Overview, discussions of Current Conditions and Arctic Sea-Ice Extent Anomalies) with contributions from John Walsh, and Richard Thoman, University of Alaska Fairbanks (discussion of Current Conditions); Michael Steele, University of Washington (Ocean Heat discussion); Edward Blanchard-Wriggelsworth, University of Washington (Spatial Field figures and discussion); Cecilia Borries-Stigle, University of Alaska Fairbanks (discussion of Regional Sea-Ice Extent); François Massonnet, Université catholique de Louvain (Antarctic Contributions discussion) Peter Bieniek, University of Alaska Fairbanks (report review); Walt Meier, University of Colorado (statistics); Matthew Fisher, NSIDC (figures); Betsy Turner-Bogren, Helen Wiggins, Kuba Grzeda, and Lisa Sheffield Guy, ARCUS (report coordination and editing); and the rest of the SIPN2 Project Team.
Note: The Sea Ice Outlook provides an open process for those who are interested in Arctic sea ice, to share predictions and ideas; the Outlook is not an operational forecast.
See: August Call for Contributions
Editor's Note: The hyperlinked captions in several figures below provide access to a high resolution version of the image.
Overview
The August Outlook is based on a total of 45 forecasts (Figure 1), of which 32 are new August submissions while six are repeated from July and seven from June. The median August Outlook value for the September 2021 sea-ice extent is 4.39 million square kilometers, with quartile values of 4.1 and 4.5 million square kilometers. Of the 45 August 2021 contributions, 12 are based on dynamical models, 21 are based on statistical methods, four are based on heuristic approaches (qualitative analyses), and eight used machine learning-based or other (ML/Other) methods. The median of the August submissions is slightly greater than that from July (4.36 million square kilometers) and June (4.37 million square kilometers). The 2021 August Outlook median is higher than the August Outlook medians in 2020 (4.30 million square kilometers) and 2019 (4.22 million square kilometers), but lower than 2018 (4.57 million square kilometers).
For the 2021 SIO August report, seven groups submitted supplemental materials (See: Contributor Full Reports and Supplemental Materials below). The supplemental material contents vary among the contributions, but they may include information on methodology on: (1) how the forecasts are produced; (2) number of ensemble members used in the forecasts; (3) whether and how bias-corrections are applied; (4) ensemble spread, range of forecasts, uncertainties and other statistics; and (5) whether or not post-processing was performed.
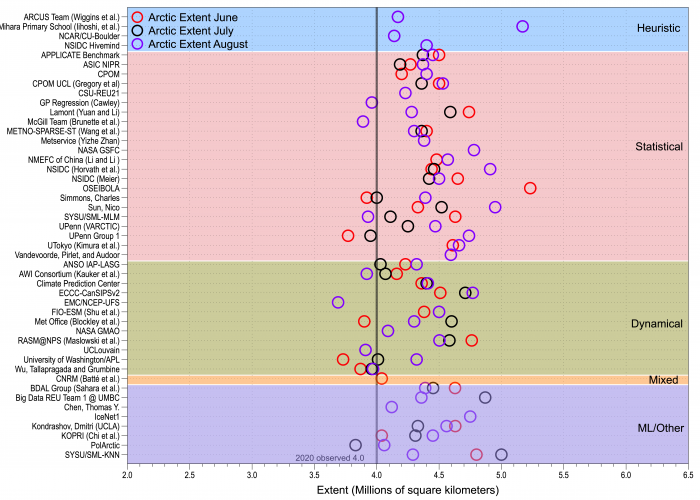
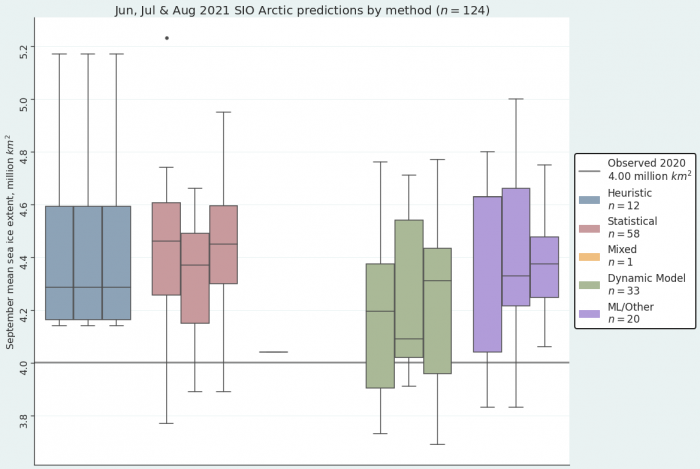
The median values vary among methods used in the August 2021 Outlook, and are (in million square kilometers for all): 4.45 for the statistical, 4.31 for the dynamical, 4.29 for the heuristic, and 4.37 for ML/Other. Of the four approaches, the ML/Other forecasts have the smallest interquartile range of 0.23, followed by heuristic forecasts with 0.4 million square kilometers. The corresponding ranges are 4.0 to 4.4 million square kilometers for the dynamical model forecasts and 4.3 to 5.0 million square kilometers for the statistical forecasts. As shown in Figure 2, the quartile ranges of the statistical and dynamical model forecasts issued in August are equal or larger than the corresponding ranges of the July forecasts, pointing to an increase of the uncertainties within each source. In contrast, the 2020 SIO quartile range of statistical and dynamical forecasts decreased from June to August. The ML/Other methods display a reduced quartile range in the August forecast compared to June and July.
Figure 3 compiles each group's 2021 submissions from June, July, and August with the 2020 mean September Arctic ice extent shown for reference. The June through August 2021 dynamical forecasts display a smaller variance, and the statistical forecasts a larger variance, than they did in 2020. The standard deviation for the June through August submissions was 0.30 for dynamical forecasts, 0.29 for statistical forecasts, 0.43 for heuristic forecasts, and 0.33 for ML/Other forecasts.
Current Conditions
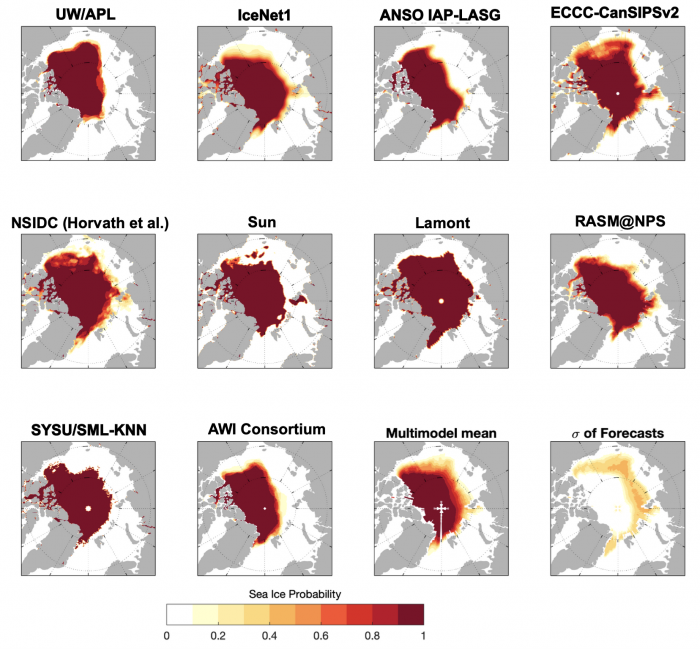
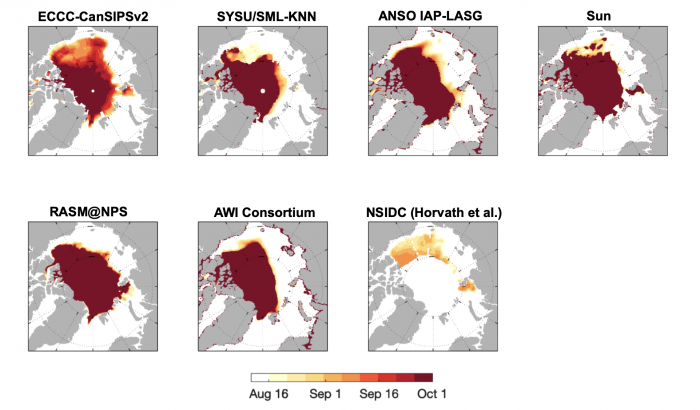
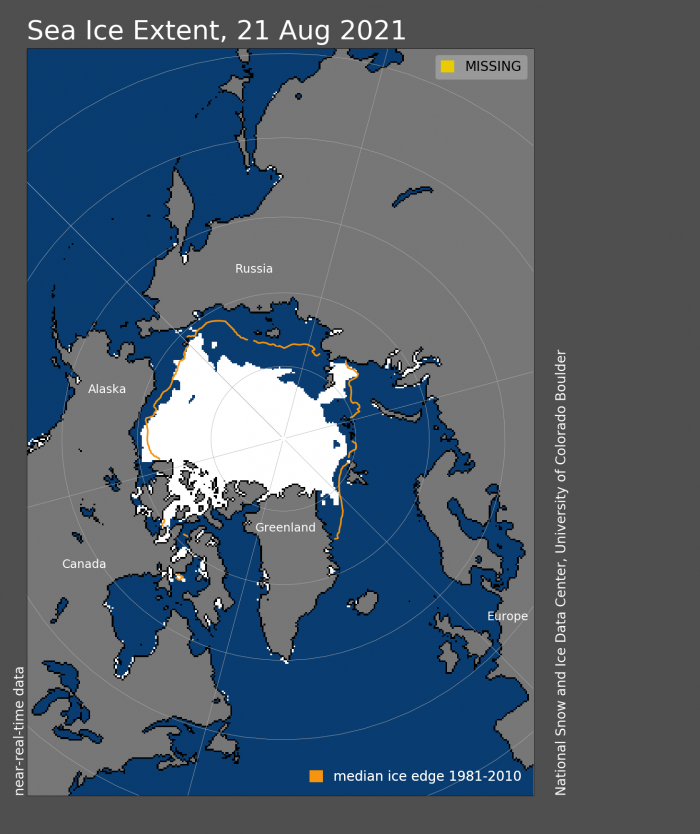
As of 22 August 2021, the Arctic sea-ice extent was 5.58 (compared with 25 August 2020 value of 4.43) million square kilometers. Arctic sea-ice extent in 2021 remains well below the climatological median and has closely followed the 2012 values for much of the summer (Figure 4) but has diverged to higher sea-ice extent starting in early August. The forecasts continue to support September 2021 mean sea-ice extent being well above the September 2020 value. July sea-ice retreat has been greatest in the Eurasian seas, particularly in the East Siberian Sea, making the 2021 ice edge well north of the long-term median edge in Eurasia (Figure 5). Sea ice retreated since the end of July along the northern coast of Alaska, although the ice edge is near its climatological position, which makes the Beaufort and Chukchi sea ice extent the largest at this time of year since 2006 (Figure 5). A tongue of sea ice that has been present all summer continues to extend close to land in the Kara Sea, making the northeast passage likely to remain blocked for the first time in several years. Half the models which provide spatial data to the SIO (see Figure 10) predict that the tongue is likely to survive.
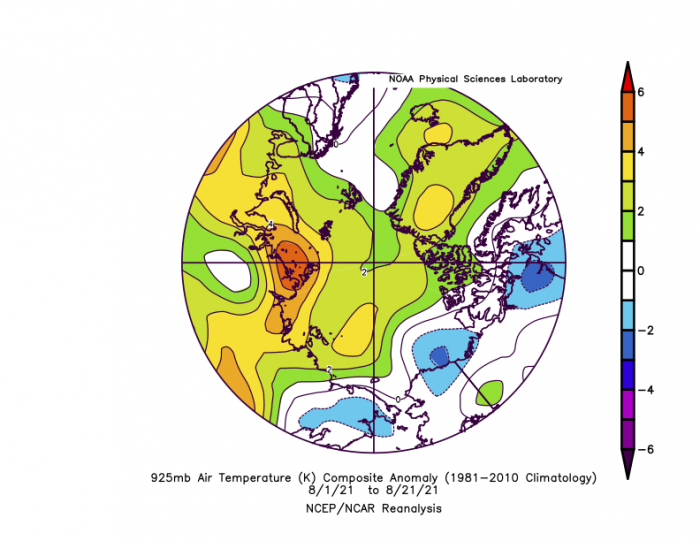
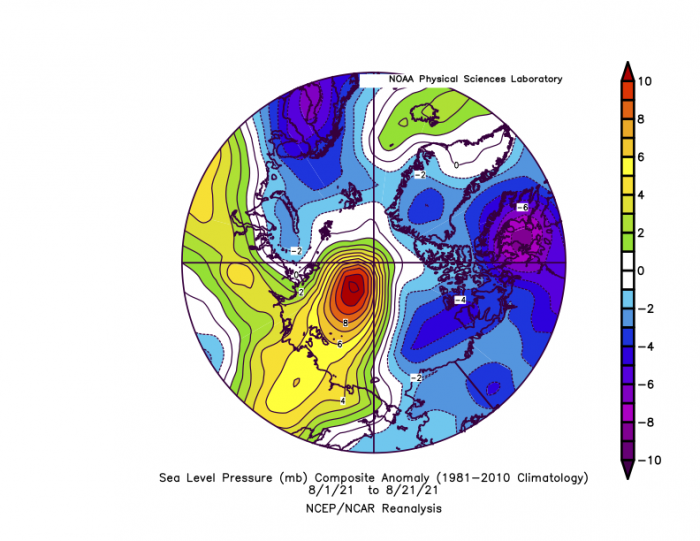
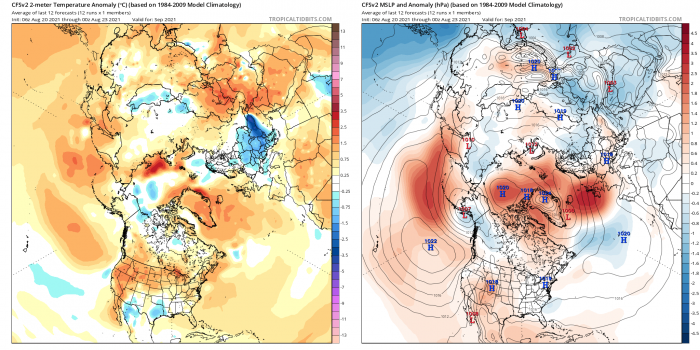
Atmospheric air temperatures at the 925 hPa level in August have been above average over the Arctic Ocean and up to six degrees Celsius above average over Eurasia (Figure 6). On the other hand, temperatures in August have been below average over a region spanning far eastern Russia to Canada (Figure 6). The positive air temperature departures are consistent with the early ice retreat in Laptev Sea during the 2021 summer season and subsequent ocean warming. A strong anticyclone (Figure 7) is centered over the Arctic Ocean and extends onto Eurasia while sea-level pressure is below average over North America, Scandinavia, and the Kara Sea (Figure 7). The NOAA CFSv2 (Figure 8) September forecast continues a somewhat similar pattern to the observations and displays warmer than average conditions in the Eurasian seas and generally high sea-level pressures over the Arctic. The September NOAA forecast of positive temperature and pressure anomalies over the Arctic favors continued sea-ice extent reduction in the Eurasian seas.
Ocean Heat
Sea surface temperature (SST) in late August 2021 is warm in many areas, although generally not as warm as in recent record-low sea-ice years. Figure 9 provides an example for 23 August 2020 compared with the same date for this year, 2021. As in 2020, a band of very cold temperature is starting to form in the far north, as the ice retreats in response to melting by warm ocean waters. The ocean has gained heat from the sun and (in some areas) from northward-moving ocean currents over the summer. Solar heating at this late date is very small, but ocean heat is now being lost to ice melt, leaving in its wake water that is at or near its freezing temperature.
Ice retreat in the Laptev and western East Siberian Sea was relatively early this year, leading to warm but not historically maximum SSTs in this area. As discussed in the July SIO, other factors might have played a role in suppressing ocean surface warming (e.g., clouds, forest fire smoke, etc.).
There is an extensive area in the Canada Basin (western Arctic Ocean) with low sea-ice concentration. A small patch of open water is evident at ~76°N, 150°W, which may grow in the coming weeks. A larger open water area was present in 2020 at this time; however, in early August 2020 it was still ice-covered. Thus, rapid disintegration of the ice pack in this region might still occur (as forecast by some models, see Predictions from Spatial Fields discussion below), although time is running out before the traditional sea-ice minimum in mid-September and the initiation of atmospheric cooling.
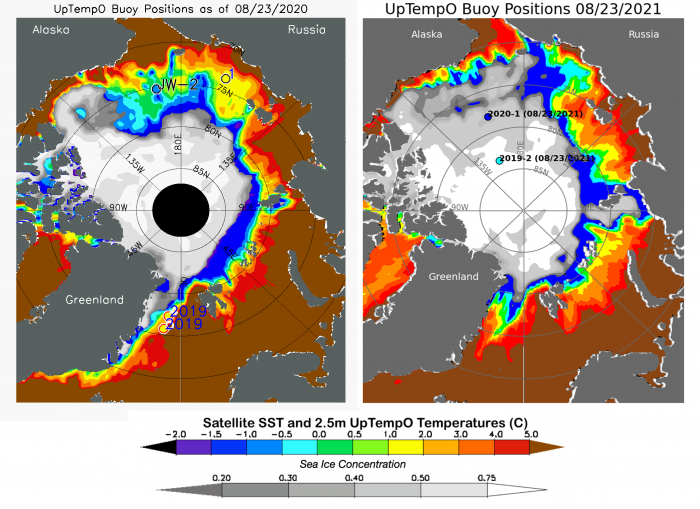
Note: Figure 9 is sourced from NOAA dOISST and NSIDC NRT passive microwave. Data for UpTempO drifting buoys locations is available for downloading from the UpTempO buoy website.
Predictions from Spatial Fields: Sea-Ice Probability, Ice-Free Date, Initial Conditions, and Ice Advance Dates
Sea-Ice Probability (SIP)
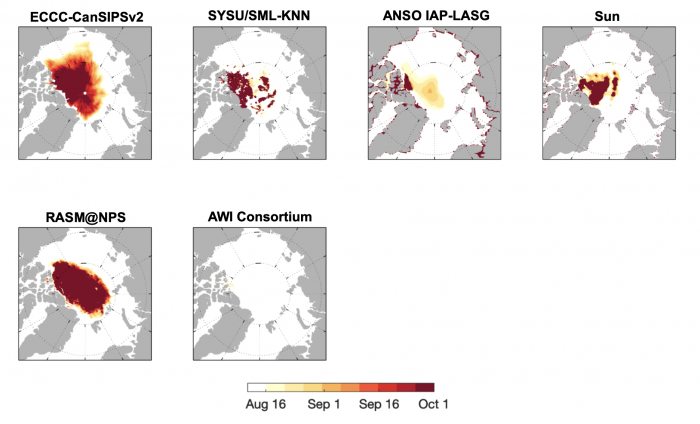
Figure 10 shows forecasts of September SIP for the August contributions. There is relatively good agreement across different models compared to past years' August SIP forecasts. There is, however, large uncertainty on SIPs in the Kara, Laptev, and East Siberian seas. Five out of nine models forecast that the Northeast Passage may not be completely clear of sea ice. The persistence of the tongue of sea ice in the Kara sea is particularly uncertain. How much sea ice will remain in the Beaufort/Chukchi north of Alaska is also uncertain, with some models forecasting survival of sea ice (ECCC-CanSIPSv2 or NSIDC-Horvath et al.), others only partial areas (e.g., Sun), and others significant melt (SYSU/SML-KNN or RASM/NPS).
Ice Free Dates (IFD)
Figure 11 and Figure 12 show forecasts of ice-free dates using the 15% and 80% sea-ice concentration thresholds. Some models show limited ice retreat throughout August and September, generally confined to the sea-ice edge region (e.g., AWI or RASM/NPS), whereas others show extensive ice retreat well into September (e.g., ECCC-CanSIPSv2 and NSIDC CU Boulder). There is much more model uncertainty in the IFD80 forecast, likely a result of higher initial condition uncertainty in sea-ice concentration values in the inner ice pack (see Figure 14 below). For example, if a model initializes with SIC below 80% in early August, by definition the IFD80 has already taken place before the forecast (which appears to be the case for AWI).
Ice Advance Dates (IAD)
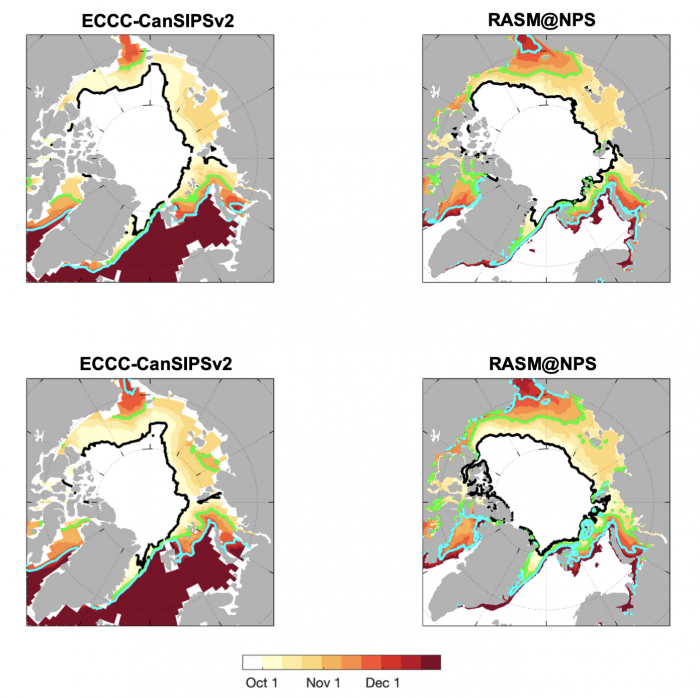
Just two models submitted Ice Advance Date (IAD) forecasts for the 2021 freeze-up season. In Figure 13 we show the dates of ice advance using a 15% SIC and 80% SIC threshold. Both forecasts differ in the IADs depending on the region. ECCC-CanSIPSv2 forecasts earlier IADs compared to RASM/NPS in the Chukchi and East Siberian seas, but later IADs in the Kara and Barents seas. Interestingly, the forecasts are very similar using either metric, representing a fast transition to near-complete sea-ice cover once freeze-up begins at a location.
Initial Conditions
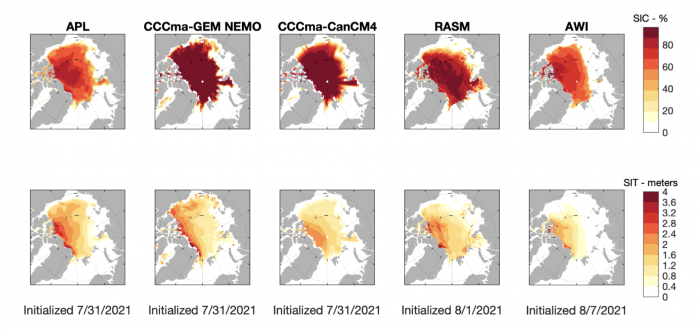
Figure 14 shows the forecasts' initial conditions of sea-ice concentration and thickness used.
Initial conditions of sea-ice concentration generally show good agreement along the sea-ice edge (with the exception of AWI), although there is some discrepancy within the inner ice pack, some models initializing with a SIC value close to 100% and others with significantly lower values. It's worthwhile pointing out that there is substantial uncertainty across observational products of SIC in summer. Forecast initial conditions of sea-ice thickness show significant spread across models. While all models are initialized with thick sea ice north of Greenland and the Canadian Arctic Archipelago, they disagree significantly in the thickness distribution in the Beaufort/Chukchi seas and north of the Kara sea.
Regional Sea-Ice Extent
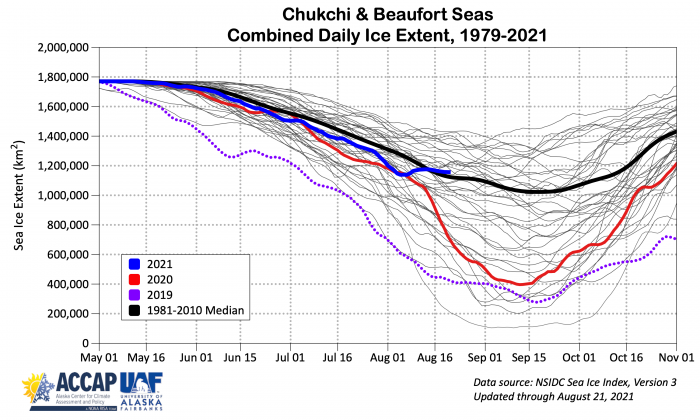
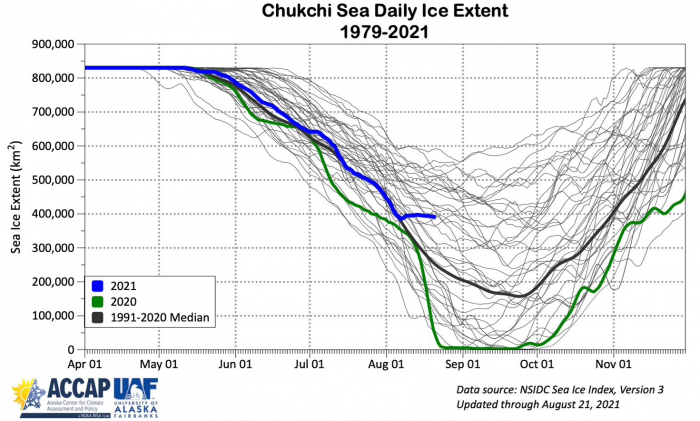
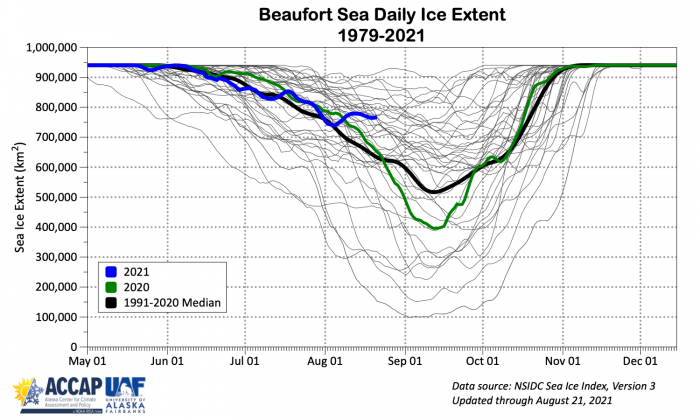
Sea ice in the Chukchi and Beaufort Seas continued its summer retreat (Figure 15); however, it is more extensive than the August 2020 sea-ice extent with portions of sea ice still along the coast of northern Alaska and the northeast coast of Chukotka. The combined Chukchi and Beaufort sea-ice extent was slightly below average for much of Summer 2021 (Figure 16) until the end of July when melting quickly increased. Sea-ice extent is highest for this point in the season since 2006 in both the Chukchi and Beaufort seas (Figure 16). Ice extent grew to above normal shortly after the beginning of August and as of 19 August was 1.15 million square kilometers. The 1981–2010 normal is 1.10 million square kilometers.
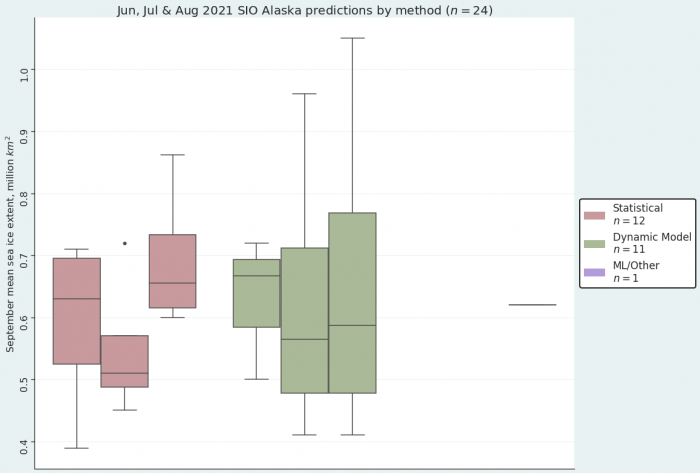
For the Alaska region, the August 2021 SIO median forecast was 0.62 million square kilometers based on nine contributions. This is higher than the July 2021 median forecast of 0.51 million square kilometers but lower than the June 2021 median forecast of 0.67 million square kilometers. The four dynamical model predictions ranged from 0.5 to 1.05 million square kilometers with a mean of 0.66 square kilometers (Figure 17). The four statistical model predictions ranged from 0.60 to 0.86 million square kilometers and had a mean of 0.69 million square kilometers. One machine learning-based prediction was submitted with a prediction of 0.62 million square kilometers.
Both sea-level pressure and temperatures have been relatively close to the climatological means this summer, much more so than in 2019, which is consistent with the sea-ice extent at this stage of the summer that is much greater than it was in 2019. The sea-ice extent is even slightly greater than in 2020, although not much greater. Therefore, in the absence of some extreme forcing in the next month or so, it will not be as extreme a sea-ice minimum as we have seen in some past years—at least in the Alaska sector.
The forecast spread for the dynamical models (standard deviation of 0.28) was larger than that of the statistical models (standard deviation of 0.12) (Figure 18), similar to the previous month's forecasts. The August 2021 SIO forecasts continue to predict Alaska sea-ice extent (Bering, Chukchi, and Beaufort seas) greater than the 2007–2020 average of 0.44 million square kilometers.
Arctic Sea-Ice Extent Anomalies
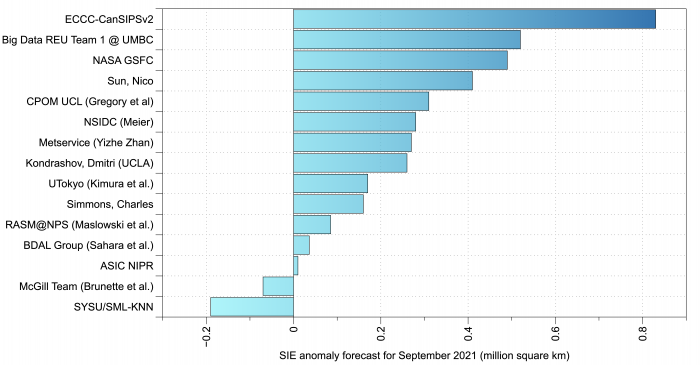
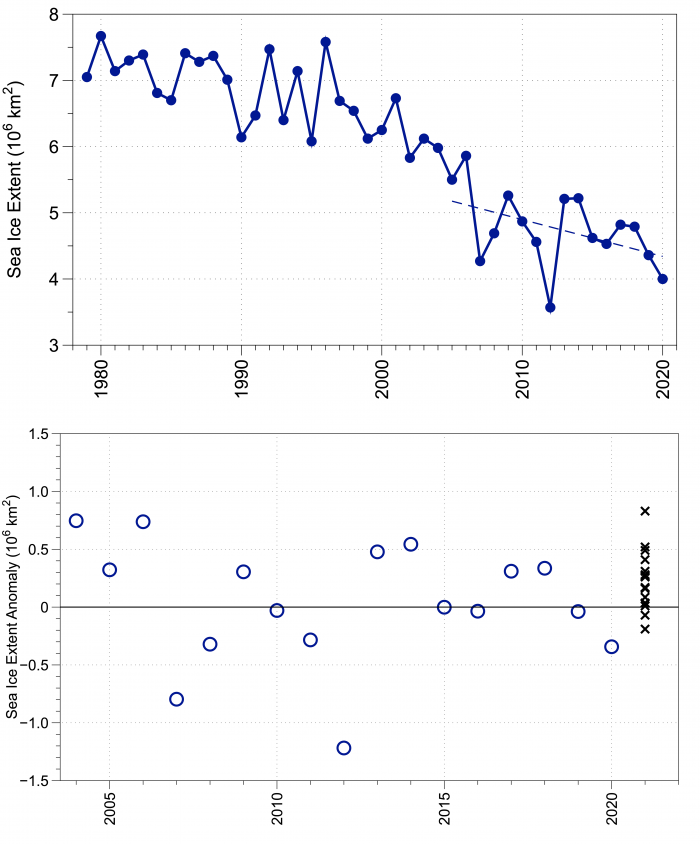
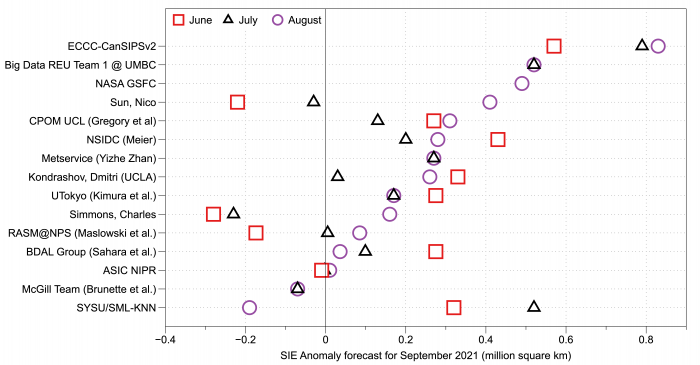
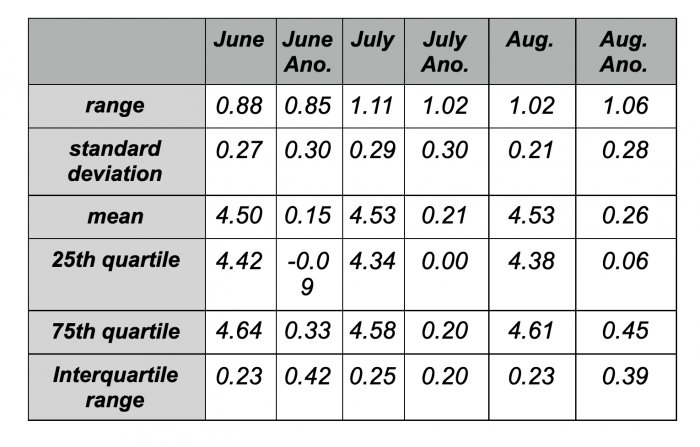
This is the first year that the SIO has solicited September mean sea-ice extent anomalies and this request emerged from the January 2021 SIO Contributor's Forum. This exercise is motivated by the large spread in SIO predictions of mean September sea-ice extent and seeks to examine if the spread is reduced when the inter-model bias is removed. The pan-Arctic sea-ice extent anomaly is the departure of the contributors' September extent Outlook relative to the contributors' baseline trend (e.g., the trend in historical observations, model hindcasts, etc.). The 15 contributions of September mean sea-ice extent anomaly range from -0.19 to +0.83 million square kilometers, with 12 forecasts above and two below the contributors' baseline (Figure 19). For historical perspective, the observed anomalies from a linear trend over the 2005–2020 period are shown in Figure 20. The observed anomalies from the trend range from -1.22 (2012) to 0.74 (2006) million square kilometers. The August SIO anomaly forecast has a standard deviation of 0.25 million square kilometers, which can be contrasted for larger spreads in June and July SIO reports (i.e., the standard deviation in July was 0.27 and June was 0.29 million square kilometers). The mean of the anomaly forecasts increased with each forecast of the summer 2021 SIO season (June=+0.15, July=+0.21, and August=+0.26) (Figure 21). Table 1 shows a preliminary comparison of standard measures of forecast spread for the anomaly and full forecasts. The use of anomaly forecasts does not show a clear decrease in inter-model spread.
Antarctic Contributions
Eight outlooks were initially submitted in June, seven were updated for the July call and the same seven were updated for the August call (Figure 22). The August call welcomed a new contribution (EMC/NCEP-UFS). As for June and July outlooks, the bulk of the forecast distribution is concentrated around the climatological and anomaly persistence forecasts and consists essentially of statistical forecasts.
Initial findings from the SIPN South project suggest that for the summer season, the forecasts of sea-ice concentration from statistical forecasts are more skillful than from dynamical ones. If the same holds for winter, then we should expect close-to-average conditions in September, continuing the conditions average observed since the beginning of the year. (See: Interactive Sea Ice Graph from Arctic Sea Ice News.
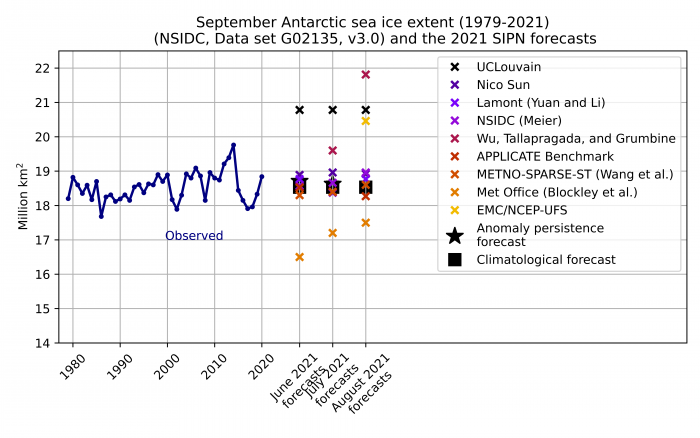
Editor's note: Figure 22 and related text were updated on 31 August 2021 to include the EMC/NCEP-UFS contribution.
Contributor Key Statements
![]() 2021 SIO August Contributor Key Statements (76.63 KB)
2021 SIO August Contributor Key Statements (76.63 KB)
Contributor Full Report PDFs and Supplemental Materials
This report was developed by the SIPN2 Leadership Team
Report Lead
Uma Bhatt, University of Alaska Fairbanks
Additional Contributors:
Richard Thoman, Alaska Center for Climate Assessment and Policy, International Arctic Research Center, University of Alaska
Matthew Fisher, Cooperative Institute for Research in Environmental Sciences at the University of Colorado Boulder, NSIDC
Editors:
Betsy Turner-Bogren, ARCUS
Lisa Sheffield Guy, ARCUS
Kuba Grzeda, ARCUS
Suggested Citation:
Bhatt, U.S., P. Bieniek, E. Blanchard-Wrigglesworth, H. Eicken, M. Fisher, L. C. Hamilton, J. Little, F. Massonnet, W. Meier, J.E. Overland, M. Serreze, M. Steele, J. Stroeve, R. Thoman, J. Walsh, M. Wang, and H. V. Wiggins. Editors: Turner-Bogren, B., L., Sheffield Guy, and J.K. Grzeda. August 2021. "Sea Ice Outlook: 2021 August Report." Published online at: https://www.arcus.org/sipn/sea-ice-outlook/2021/august
This Sea Ice Outlook Report is a product of the Sea Ice Prediction Network–Phase 2 (SIPN2), which is supported in part by the National Science Foundation under Grant No. OPP-1748308. Any opinions, findings, and conclusions or recommendations expressed in this material are those of the author(s) and do not necessarily reflect the views of the National Science Foundation.
