Highlights
Report Sections:
1. Introduction
2. Review of Arctic 2016 Conditions
3. Review of 2016 Sea Ice Outlooks
4. Review of Statistical Methods
5. Review of Dynamical Models
6. Methods of Forecast Initialization by Dynamical Models
7. Local-Scale Analysis of 2016 Sea Ice Outlooks
8. Sea Ice Forecasts: Local Use & Observations
9. Probabilistic Assessment of the 2008-2016 Outlooks
10. Lessons Learned in 2016 and Recommendations
11. Report Credits
12. References
The Sea Ice Outlook (SIO), a contribution to the Study of Environmental Arctic Change (SEARCH) provides an open forum for researchers and others to develop, share, and discuss seasonal Arctic sea ice predictions.
2016 Submissions: We sincerely thank the participants who contributed to the 2016 SIO! This year we received a total of 104 submissions of pan-Arctic September extent forecasts, with 30 in June, 35 in July, and 39 in August (a record number of contributions). This year for the first time we also collected forecasts of the extent in the combined Chukchi, Bering, and Beaufort seas, which we are calling the “Alaskan Region”.
Observed and Predicted Extent: The observed mean extent for the month of September was 4.7 million square kilometers—almost 2 million square kilometers below the average September extent for 1981–2010, but 1.1 million square kilometers above the record low in September 2012. The median Outlook across all methods was 4.3 million square kilometers in June and July, and 4.4 million square kilometers in August. Across all methods, the interquartile range in August just barely included the observations, and it fell short in June and July (with an upper value at 4.6 million square kilometers).
Methods: Compared to other methods this year, the median and interquartile range of the Outlooks from dynamical models (ice-ocean and ice-ocean-atmosphere) are a better match with the observations. In addition, initial analysis indicates that the use of sea ice observations for model initialization improved the model skill. This year’s report contains significant discussion on the different Outlook prediction methods used.
Weather Patterns - The conditions this season were exceptional in several ways, with spring record-setting high temperatures and low sea ice extent, then a cooler weather pattern with a strong August storm, and rapid freeze-up in mid/late September. A detailed look at the conditions this season uncover interesting patterns between weather and sea ice, and leads us to consider the importance of collecting forecasts in seasons other than summer.
Using Metrics Other than Extent - Compared to the record low month of September 2012, the sea ice in September 2016 was higher in extent, but lower in concentration within the central ice pack—we saw a more spread-out sea ice pack. The report discusses this pattern and implications for use of metrics other than extent. See the NSIDC “All About Sea Ice” webpage for an explanation of extent versus area versus concentration.
Introduction
The Sea Ice Outlook (SIO) Post-Season Reports are a synthesis of the Arctic conditions that occurred during the recent forecast "season", namely the state of the Arctic in May and the evolution of the sea ice and climate through September. The Sea Ice Prediction Network (SIPN) is a community of scientists and stakeholders with the goal of advancing understanding of the state and evolution of Arctic sea ice, with a focus on communicating forecasts of the Arctic summer sea ice fields and the pan-Arctic September extent. Members of SIPN contribute to the SIO, and a SIPN project leadership team manages the Network, the SIO, and informational resources and activities to improve forecasts.
We thank the participants who contributed to the 2016 SIO. This year we received a total of 104 submissions of pan-Arctic September extent forecasts, with 30 in June, 35 in July, and 39 in August. About a half dozen of the teams who submitted pan-Arctic forecasts also submitted full fields of a few sea ice quantities. This year for the first time we also collected forecasts of the extent in the combined Chukchi, Bering, and Beaufort seas, which we are calling the "Alaskan Region". We received 3 in July and 4 in August. We discuss these Outlooks, and compare them to each other and the observations this year.
This year was an exceptional year in many ways, so we expanded the typical Post-Season Report purview this year to include the Arctic conditions in winter and fall 2016. We are also pleased to include, for the first time, a discussion of societal use of sea ice forecasts, with local observations from Arctic residents. Other highlights that are new in this report include a review of statistical methods, methods of forecast initialization, and a probabilistic assessment of all the pan-Arctic extent Outlooks since 2009.
Review of Arctic 2016 Conditions
Winter and spring 2016 in the Arctic were characterized by record-setting high temperatures and low sea ice extents. Specifically, record low monthly sea ice extents were set in every month from January to June in 2016, except for March 2016, which was well within the measurement uncertainty to the record low of March 2015 (see Figure 1). Though the extent anomalies in 2016 were even larger in the summer months than they were in winter and spring, compared to other years the rank of the summer months in 2016 fell behind. The fall months returned to record setting lows. In this section we describe the major events that led to these sea ice conditions.
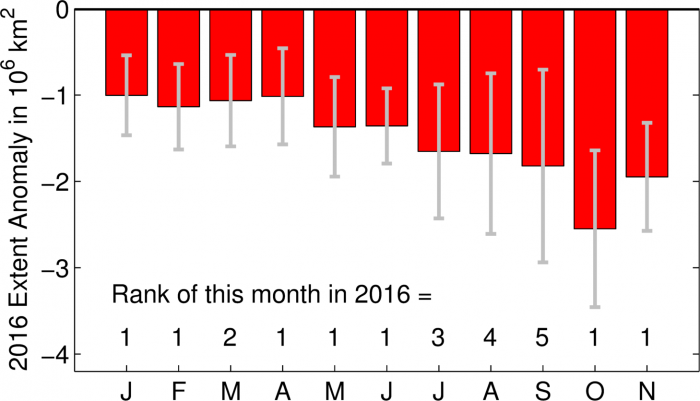
Although the sea ice extent on the day of the minimum in 2016 tied for the second lowest on record, the mean extent for the month of September was the fifth lowest and very near the linear trend line, at 4.72 million square kilometers (see Figures 1 and 2), based on the processing of passive microwave satellite data using the NASA Team algorithm by the National Snow and Ice Data Center (NSIDC). September 2016 was almost 2 million square kilometers below the average September for 1981-2010, but 1.1 million square kilometers above the record low, September 2012.
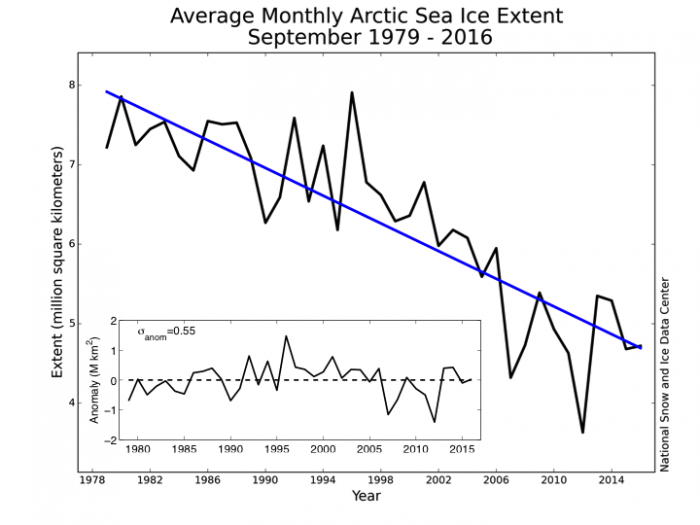
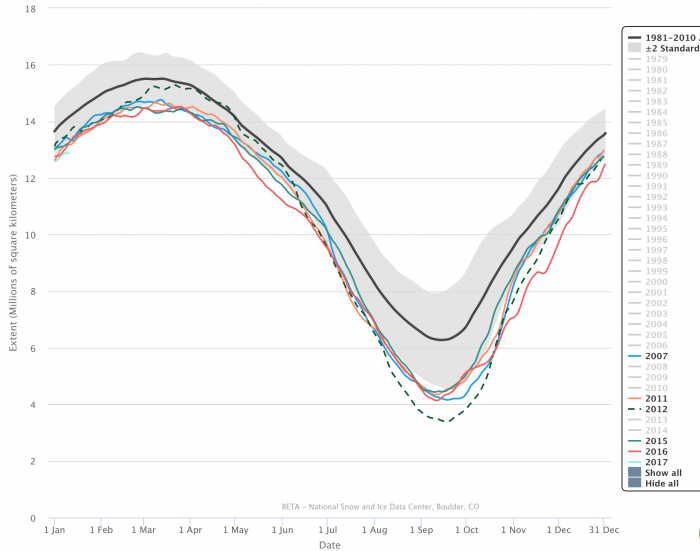
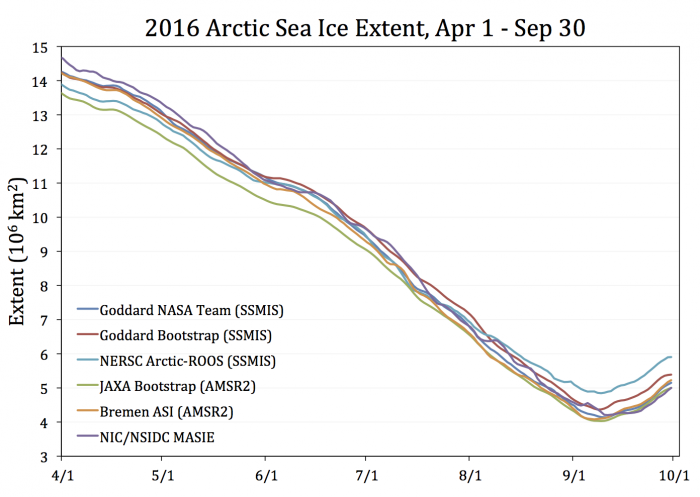
To evaluate the pan-Arctic Outlooks (i.e., for verification) of the September sea ice extent, we use the NSIDC sea ice extent estimate (based on the NASA Team algorithm, see Figures 2 and 3). The 2016 data are near real time and as such are not as quality controlled as the product in past years (explained further at NSIDC). Furthermore, there are a range of estimates of observed extent from other algorithms using the same data from passive microwave sensors shown in Figure 4. The SIO 2015 Post-Season Report explains why these algorithms yield different estimates, based on factors such as land masks, resolution, etc. The range of estimates from these algorithms in Figure 4 provides an indication of uncertainty in the observed extent. All but the National Energy Research Scientific Computing Center's (NERSC) Arctic-ROOS algorithm are generally within ~0.4 million square kilometers.
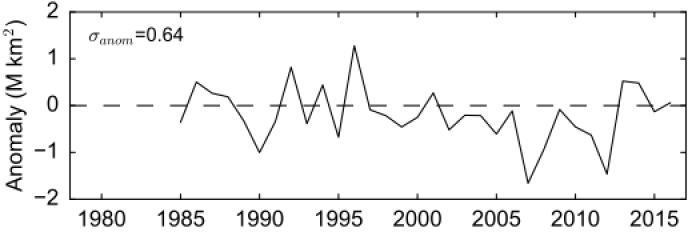
Even once we settle on an algorithm for the observed sea ice extent, there are several different potential baseline metrics from which to assess forecast skill. We expect a forecast with a 2-4 month lead time, such as in the SIO, to be skillful if the forecast error (the difference between forecast and eventual observation) is smaller than some measure of typical year-to-year variability. One measure of the variability is the standard deviation of the departures from the linear trend line shown in Figure 2. Another is the deviation from the trend persistence, shown in Figure 5. The difference is subtle. The trend persistence for a given year uses only information from the past to compute a trend from 1979 to (year-1). The anomaly of a given year is then relative to the persistence of that trend carried forward into the current year. The standard deviation of the anomalies in Figure 5 are slightly larger, and it is therefore a more relaxed threshold for skill.
The Melt Season in Review
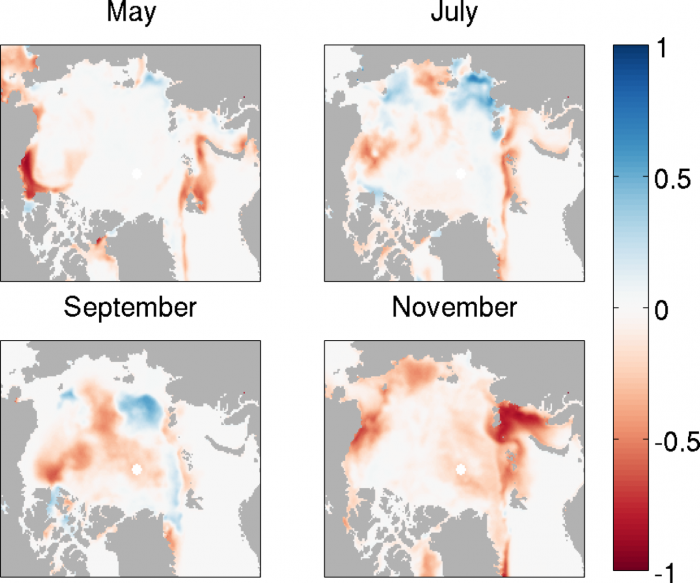
The winter and spring of 2016 were exceptionally mild in the Arctic. This contributed to the lowest maximum Arctic sea ice extent recorded in the satellite era in March 2016 and an unusually early start to melting in the Chukchi and Beaufort seas in late April, which continued into May. As a result, the distribution of sea ice fraction in May 2016 was low in the south Beaufort, Bering, and Barents seas (Figure 6). Airborne sea ice thickness surveys over the Canadian Arctic Archipelago and the southern Beaufort Sea revealed that first-year ice was anomalous thin (< 2m), likely a result of the unusually warm winter that limited growth of first-year ice. Near Barrow, Alaska, thickness surveys from IceBridge suggest areas of thin ice, which is confirmed from Barrow Ice Mass Balance (IMB) buoys. Landfast ice never exceeded 1m this year at Barrow, which appears to be a result of reduced winter ice growth and early melt onset in April. The sea ice in these approximate areas remained low throughout the summer and remained low in December 2016.
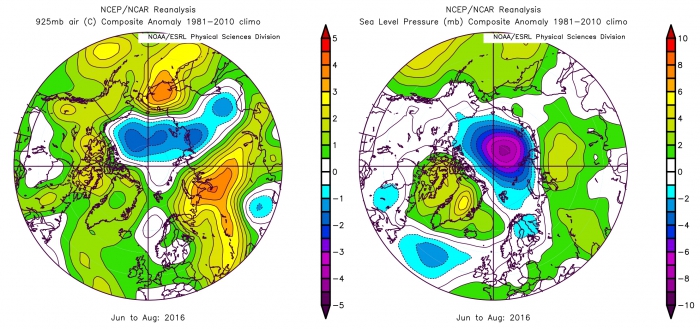
At the end of May there was a change in the weather, and much colder, but stormy conditions were prevalent over the Arctic Ocean during June, with ice melt slowing. Arctic weather during the remainder of the summer was unexceptional, often unsettled, and at times quite cool (Figure 7), although there were occasional incursions of very warm air, for example in the East Siberian Sea at the beginning of August.
August Storm
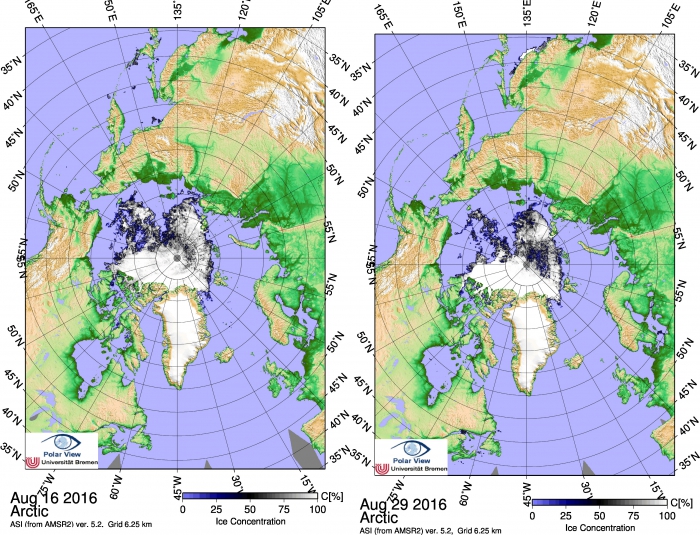
An unusually strong and persistent cyclone affected the Arctic during mid-August 2016. This storm entered the Arctic Ocean from the Siberian continent on 13th August, and remained in the central Arctic for several days, with central pressure falling close to 970 hPa before gradually decaying in late August. A similar event occurred in early August 2012, with an even stronger (966 hPa) but less persistent storm apparently acting to increase melting of dispersed sea ice in the East Siberian Sea (Zhang et al, 2013). The stormy conditions this year coincided with a substantial decrease in ice coverage along a narrow southward protrusion of ice into the East Siberian Sea in late August (Figure 7), and may have similarly assisted in sea ice melting close to the North Pole.
The other notable feature of the 2016 Arctic summer was a very rapid increase in sea ice extent from the date of minimum (10th September) to the end of the month. The average (1981-2010) increase in sea ice extent during the same time period is 0.71 million square km; whereas in 2016, ice extent increased by 1.12 million square km, the fourth highest amount in the satellite era. The early freeze-up occurred primarily in areas of the Beaufort, East Siberian, and Laptev Seas bordering the Central Arctic, corresponding broadly to the area previously occupied by the narrow "arm" and that still contained some patches of dispersed ice on 10th September. The dispersed ice in this area may have absorbed heat from the upper ocean layer during late summer, holding sea surface temperatures close to the freezing temperature and allowing for the observed rapid refreeze.
Unusually Unconsolidated Late Summer Pack
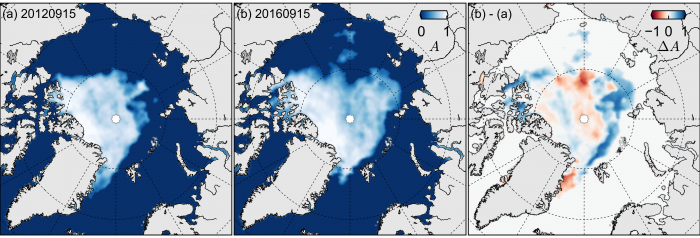
Compared to the record low month of September 2012, the sea ice in September 2016 was higher in extent, but lower in concentration within the central ice pack (Figure 8). This pattern in 2016 in September reflects advection of the earlier anomalies with the mean sea ice circulation and the strong influence of summer storms breaking up and advecting the ice towards the Russian coastline. For forecasts made in spring, the advection of spring anomalies offers some predictability. While the storm would be impossible to predict in any detail in spring, the high degree of break-up associated with summer storms might have been anticipated given the early melt onset and anomalously low ice cover in spring.
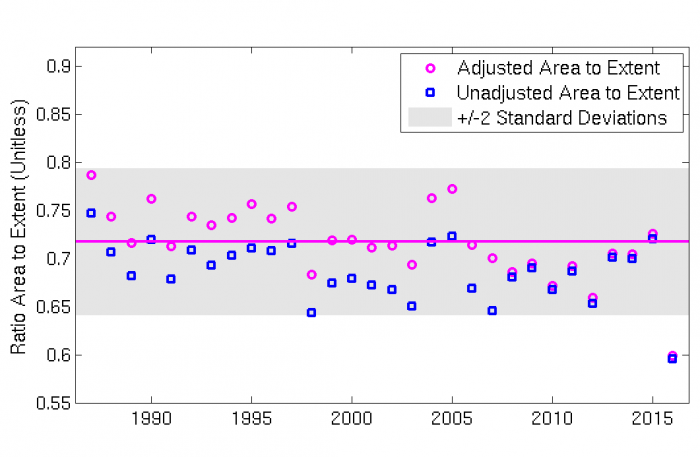
During the sea ice melt season, area estimates can be misleading because surface melt is incorrectly interpreted by the algorithms as reduced concentration. However by September, most surface melt has ended and it is possible to have more confidence in area estimates. Further, the sea ice by September 2016 was so unconsolidated that the extent index is likely not the best indicator of the degree to which the ice was anomalously low. Given that the sea ice was unusually dispersed, September 2016 had a remarkably low ratio of sea ice area to extent (Figure 10). A lower ratio indicates that there was an unusually high amount of open water included in the extent (i.e., the region with an ice concentration of at least 15%). In other words, the sea ice tended to be less compact than in the past. If the compactness had been similar to previous years, then the September mean extent would have been about 4.2 million square kilometers. This is 0.5 million square kilometers lower than the official figure. So long as extent is the target metric for prediction, the unusual conditions in 2016 emphasize the importance of forecasting the distribution of sea ice as opposed to just the total area or volume. A further lesson learned is the value of considering additional metrics when evaluating sea ice predictions.
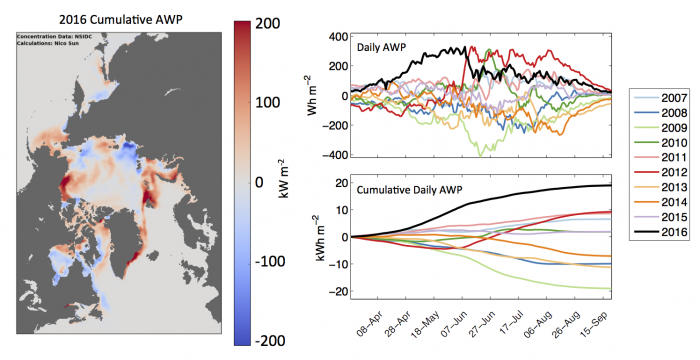
The extreme low sea ice coverage in fall (October and November) 2016 is likely related to the areas of high sea surface temperature (SST) in summer 2016 (Figure 11). In turn the high summer SST likely reflected the low sea ice coverage in early summer in the Beaufort and Barents seas, giving the ocean surface a head-start on absorbing sunlight. The influence of sea ice concentration on surface solar absorption can be seen in Figure 12 for a quantity known as the Albedo Warming Potential (AWP), developed by self-described citizen scientist Nico Sun (click here for a detailed description). A map of the cumulative astronomical-summer AWP anomaly (based on observations through 21 September) resembles the November sea ice concentration anomaly in Figure 6. Thus we suspect the low cover this fall might have been partly predictable and suggest the 2016 conditions are motivation for the SIO to expand into collecting forecasts in fall and other seasons. We discuss this further in the section on recommendations.
From the daily graphs of AWP in Figure 12, it is clear that the exceptionally low 2016 sea ice cover in spring (see Figures 1 and 6) had a significant effect on the melt season. However, by mid June, cold weather eliminated a large part of the earlier anomalies and prevented the normal widespread formation of melt ponds, forcing the 2016 AWP to drop significantly behind 2012 and 2010. In most days from July onward, 2016 remained tied for the second highest year. The cumulative AWP emphasizes the early anomalies in the daily AWP, and hence 2016 is the clear record high in cumulative AWP in all months. Because the sea ice edge is generally moving northward during the spring and early summer, the edge is moving away from the regions where anomalies in the cumulative AWP are building. However, when the sea ice edge expands southward again in the fall, it can re-encounter the regions of significant cumulative AWP. Thus, there can be a connection between patterns of spring and fall sea ice concentration anomalies that is nearly independent of mid summer conditions.

Review of 2016 Sea Ice Outlooks
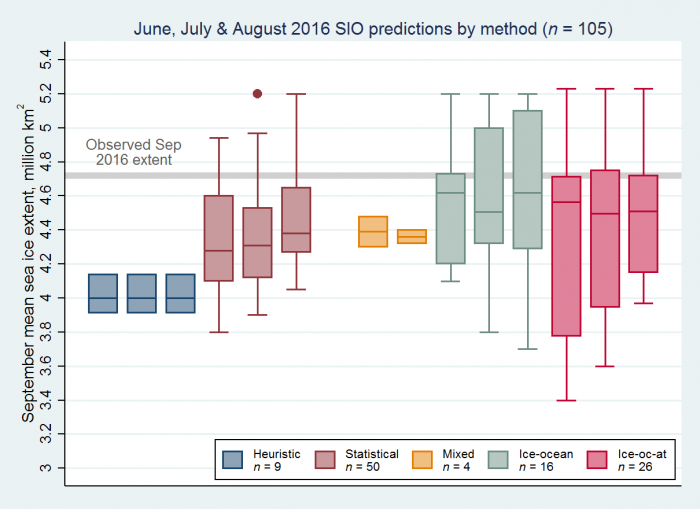
The Outlooks of pan-Arctic sea ice extent submitted in 2016 are summarized in Figure 13 with the observed ice extent of 4.7 million square kilometers taken from the NSIDC sea ice index. The median Outlook across all methods was 4.3 million square kilometers in June and July and 4.4 million square kilometers in August. Across all methods, the interquartile range in August just barely included the observations, and it fell short in June and July (with an upper value at 4.6 million square kilometers).
Compared to other methods, the median and interquartile range of the Outlooks from dynamical models (ice-ocean and ice-ocean-atmosphere) are a better match with the observations this year. Usually improvements in the forecast error (or bias) and range are expected if the forecast period, known as "lead-time", shortens and information from June and July can be incorporated in later forecasts. There is some evidence this is the case in Figure 13, as the median of statistical methods became progressively less biased and there are fewer extremely low Outlooks from ice-ocean-atmosphere models in August compared to June or July.
In the previous section we discussed the fact that the range of observational estimates of the September sea ice extent is about 0.4 million square kilometers in 2016. The same was true in 2015. The NSIDC sea ice index was near the bottom of the range, so the forecast error of the median Outlook would not be lower if we simply chose a different observational estimate of the September sea ice extent for verification this year. Further, given that the NSIDC sea ice index is the official estimate used for the SIO, the participants of the Outlook have likely already developed their forecast system to target the NSIDC sea ice index.
In the previous section we discussed the variability of the September sea ice extent and estimated its standard deviation at about 0.6 million square kilometers (both methods round to this number). The forecast error of the median Outlook across all methods is well within one standard deviation. The error of the median Outlook of any particular method except for heuristic is also within one standard deviation. By August, the error of about ¾ of the individual Outlooks were within one standard deviation.
We mentioned in the previous section that sea ice in September 2016 had an unusually low compactness (the ratio of area to extent). We estimated that, given the area of ice observed this year, if compactness had been like an average year (pink solid line in Figure 10) then the extent would have been about 0.5 million square kilometers lower, or about 4.2 million square kilometers. It is interesting to see that this value is roughly at the lower limit of the interquartile range of the Outlooks for all but the heuristic group in Figure 13.
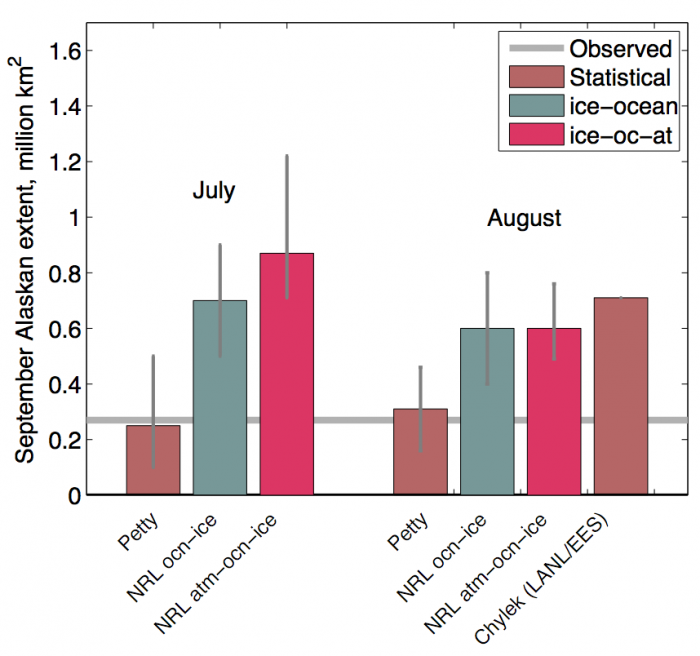
This year in the SIO for the first time, we requested participants optionally submit an estimate of the sea ice extent for the Alaskan region, defined here as the combination of the Bering, Chukchi, and Beaufort seas. We asked contributors to take the boundaries for these seas from the NSIDC Arctic sea ice regional graph.
We received three Outlooks of the Alaskan regional sea ice extent in July and four in August, shown in Figure 14. The observed 2016 extent in the Alaskan region (using the near real-time NASA Team algorithm) was 0.27 million square kilometers. The Outlooks submitted by Petty were very close, and the others were too high, even when taking into account the uncertainty in the estimates. An extrapolation of the observed linear trend from 1987 to 2015 is 0.39 million square kilometers and the average of the last 10 years is 0.54 million square kilometers. By either of these baselines, the 2016 observed Alaskan regional extent was lower. This year is the second lowest on record, though considerably more than the record low in 2012 of 0.12 million square kilometers.
Review of Statistical Methods
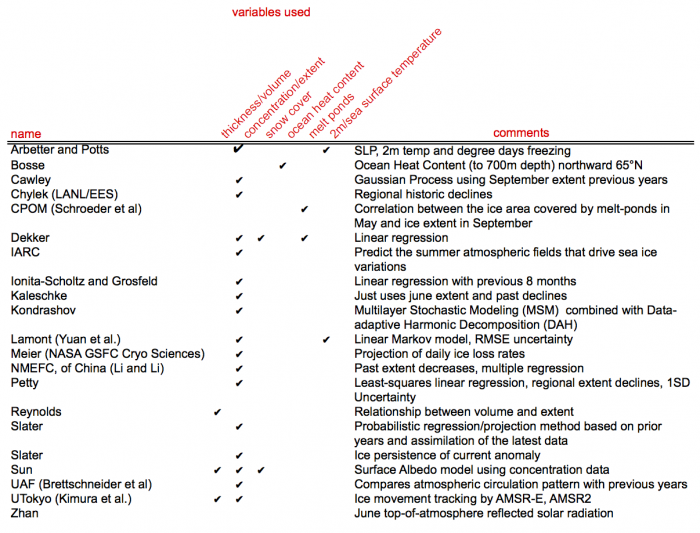
A variety of statistical methods are used by SIO participants. The table below is a summary of the methods used in 2016. The vast majority of participants only use sea ice extent/concentration as a predictor. However, there is a great diversity of how it is used, such as by multiple linear regression with previous months to simple persistence of anomalies from mid summer to more complex stochastic methods. A small number of participants base estimates on predictors other than sea ice concentration or extent, and six participants use multiple variables as predictors. Most participants take into account the trend in their method.
There is no evidence based on 2016 alone that the forecast error depends on any broad classification of the statistical methods. Thus, it is not possible to conclude that there is a benefit from using any particular set of variables as predictors. Such an assessment might be possible as we collect data in future years.
Review of Dynamical Models
Here we explore the dynamical model frameworks used in the 2016 SIO. Figure 15 is a visual representation of the spread in model configuration and the forecast error associated with the different forecasts across this SIO ensemble. The figure presents forecasts based on model components, atmospheric forcing, and post-processing (post-processing is an attempt to remove the bias of a forecast system based on past forecast error).
We don't find compelling evidence that submissions grouped by any particular component, forcing or post-processing leads to systematically better forecasts, however we are still limited by the relatively low number of submissions (as in the 2015 SIO, see Figure 13 of the 2015 Post-Season Report). Indeed Figure 15 clearly highlights that we are still only exploring a small fraction of the possible model configurations available, and we instead see groupings of similar model frameworks (e.g., the three groups using the SIS sea ice model also the MOM-4 ocean model). This is to be expected, as ocean and sea ice models often are developed in conjunction and because the number of possible choices to make in the experimental design is comparable to the number of submissions.
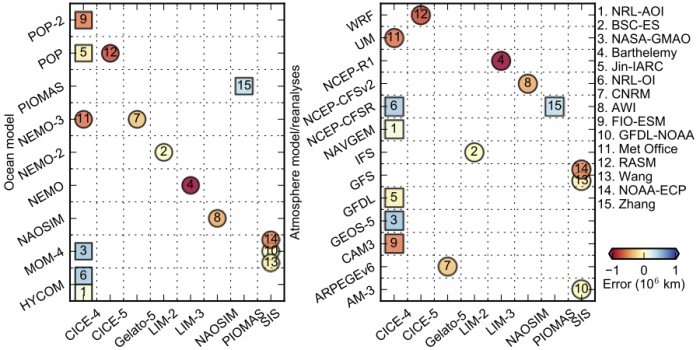
We do observe that the dynamical models tended to underestimate sea ice extent (more reds than blues) in contrast to 2015 (more blues than reds). It is also interesting to note that six models used CICE (version 4) but showed no consistency in underestimating or overestimating sea ice extent. Again, this is more anecdotal than statistically significant, but highlights the type of research we could produce given more SIO submissions. We thus continue to encourage more groups to participate in the 2017 SIO using new sea ice models (even very simple ones), exploring different physical parameterizations if possible, and perturbing uncertain parameter values in order to generate a spread of estimates that reflects uncertainty in the predictions.
Methods of Forecast Initialization by Dynamical Models
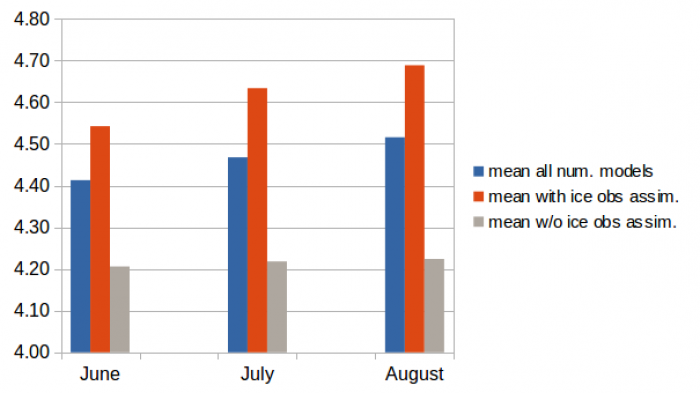
The heterogeneity of the methods used for forecast initialization by dynamical models is very large. Some teams rely on an initial state from a simulation leading up to present that is forced with prescribed atmospheric conditions but without any additional constraints from sea ice observations, while others perform direct assimilation of relevant sea ice observations or initialize the models by using sea ice analyses performed by third parties (e.g., Numerical Weather Prediction centres or the PIOMAS analysis). The data assimilation (DA) methods applied by the last two groups range from very simple methods to more sophisticated but costly methods (nudging, optimal interpolation, several versions of ensemble Kalman filtering, 3dvar, 4dvar with adjoint). A detailed analysis of the performance of each method with respect to the initialization is not possible due to the lack of detailed information in the SIO reports, and more importantly due to the lack of years available for validation. However, the benefit of assimilating sea ice observations can be estimated by breaking down all dynamical model-based outlooks into two groups. The first group consists of those using sea ice observations for the initialisation, specifically sea ice concentration (SIC) and in one case SIC and sea ice thickness (SIT), regardless of whether direct assimilation or third-party analyses are used for initialisation. The second group encompasses those using no assimilation of observed SIC or SIT (although some are utilizing sea surface temperature SST and or sea level elevation SLE observations) .
Figure 16 shows the ensemble mean sea ice extent for all numerically based outlooks (blue - 13 members), for those of the first group (orange - 8 members), and for those of the second group (grey - 5 members). The first group (1) is distinctly closer to the observed extent (NSIDC 4.72 million square kilometers) for all three months of outlooks and (2) an improvement of the forecast from June to August is recognizable in the first group but absent for the second group. These points could be an artefact because some groups to not update their Outlooks from June to July or from July to August.
Although only 2016 is used in this analysis and a generalization of the results might be too daring, we can state that the use of sea ice observations for initialization in June 2016 improved the skill of the ensemble mean considerably and groups using no sea ice observations for initialization are encouraged to include sea ice observations into their initialization approach.
Local-Scale Analysis of 2016 Sea Ice Outlooks
In 2016 a number of teams submitted predictions at the local-scale for sea ice extent probability (SIP - probability to have SIC larger than 15%), six for the June Outlook (AWI, GFDL, MetOffice, NASA, NRL FC [fully coupled], NRL IO [ice ocean]), and five for the July and August Outlook (AWI, GFDL, MetOffice, NOAA CFS, NRL IO). All are dynamical models and the majority is fully coupled, with the exception of AWI and NRL IO. Maps of SIP are shown for all models submitted to the July SIO together with the July ensemble mean and observations in Figure 17. Except GFDL all models use sea ice observations for initialization (see "Methods of Forecast Initialization by Dynamical Models" section).
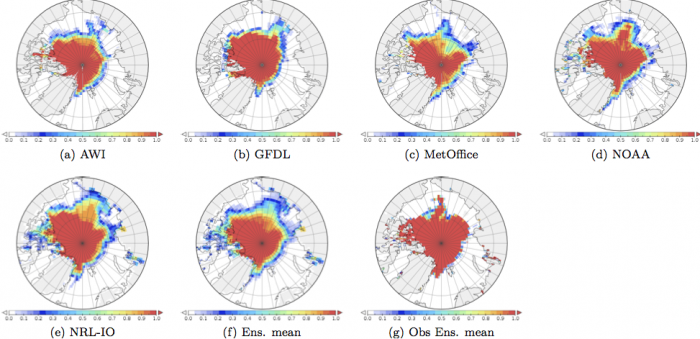
Uncertainty in the the observations can be taken into account, which will result in SIP less than 1.0 (see Figure 17 panel g). We have estimated this uncertainty from the spread (due to disagreement) of a set of different versions of the same observations (the ensemble consists of passive microwave SIC from CERSAT/IFREMER, HADISST2.1, and OSI SAF). The ensemble mean and standard deviation are calculated from the set by assuming a Gaussian distribution. The 'observational' SIP is less than one north of the Chukchi Plateau, where a relatively small tongue of sea ice survived in summer 2016. None of the models were able to predict this tongue correctly, but almost all predicted some non zero probability in an area a bit further East—one might speculate that this is connected to excessive ice drift in the Beaufort Gyre in the models. The other area of large differences between most of the models and the observations is north of the Laptev Sea, where the ice margin extended very far to the South in this year.
To further evaluate the spatial pattern of SIP among the models, we use an area integrated (half) Brier score (called a "Brier skill score" in previous SIO reports, computed by Blanchard-Wrigglesworth, and called here a "Spatial Probability Score" or SPS discussed in Goessling and Jung, manuscript in prep.) defined by:

where the subscript "f" denotes the forecasts and the subscript "o" the observation. A similar metric has been used for the last year post-season report but the metric was normalized by by total area where there is, or has been in the past, ice in September (pers. comm. E. Blanchard-Wrigglesworth). SPS can be considered the spatial analog of the Continuous Ranked Probability Score (CRPS). The deviations between the models and the observations can be seen more clearly in Figure 18 where the integrand of equation (1) is displayed.
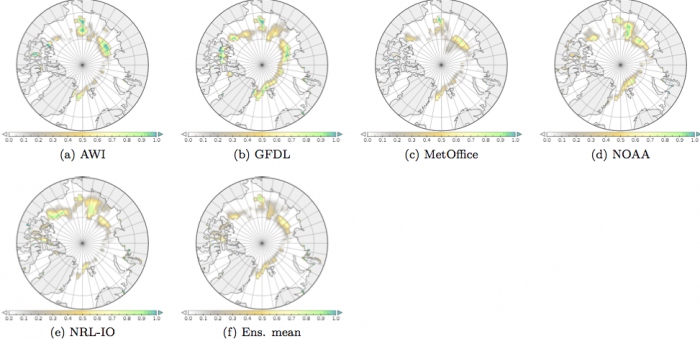
The integration of the maps in Figure 18 gives the SPS, which is shown in Figure 19 (panel a) for the June to August SIO from all available SIPs. SPS values range from 0.46 to 1.26 million square kilometers (smaller numbers indicate smaller error). A considerable decrease of the SPS from the June to August SIO, as might be expected, is not recognizable for most of the models; on the contrary, the majority of models shows an increase. The ensemble mean (calculated from the ensemble mean SIP) does decrease from June to July, but the interpretation is uncertain because not all groups submitted SIPs in all months.
![Figure 19: The Spatial Probability Score (SPS) metric (square kilometers) (left) and sea ice extent (SIE) anomaly [square kilometers] (right, the anomaly is relative to the NSIDC sea ice index ) for the June to August Outlooks. The units of SPS and SIE are million square kilometers. Figure made by F. Kauker. Figure 19: The Spatial Probability Score (SPS) metric (square kilometers) (left) and sea ice extent (SIE) anomaly [square kilometers] (right, the anomaly is relative to the NSIDC sea ice index ) for the June to August Outlooks. The units of SPS and SIE are million square kilometers. Figure made by F. Kauker.](/files/resize/sio/26833/figure_19_combined-700x232.jpg)
If the SPS metric is compared to the sea ice extent (SIE) metric (Figure 19), it can be deduced that the models with the lowest SPS (AWI, MetOffice, NOAA) are among the models with the largest SIE anomaly, i.e., the SPS metric and the SIE metric are complementary. In fact, the metrics are describing different aspects of forecast quality and neither is sufficient alone to quantify the forecast quality.
Sea Ice Forecasts: Local Use & Observations
The Sea Ice Outlook originated with a sole focus on understanding pan-Arctic sea ice extent on a seasonal timescale; however, SIPN leadership has adapted the Outlook over the years to increasingly consider information needs of stakeholders such as residents of local Arctic communities and the maritime industry or the broader public. This has been done through inclusion of regional Outlooks, solicitation of early-season Outlooks and metrics other than extent (e.g., ice-free dates, spatially-explicit prediction maps), inclusion of local sea-ice observations by Indigenous experts, and engagement of the public through citizen-science activities and public surveys. This section describes the issues and challenges specific to Arctic communities' use of sea ice forecasts and observations of sea ice.
Arctic sea ice plays a key role in global climate and in local communities' long term adaptation strategies. As the ice retreats, challenges concerning human activities in a rapidly changing environment will intensify. Climate change and modernization have thus become two intrinsically linked forces that severely alter the context in which the Indigenous populations of the region sustain a livelihood (Roanne and van Voorst, 2009). Local animal and plant species are of dietary importance, while hunting, fishing or foraging are all of cultural and social value. The availability of many species that Arctic Indigenous people rely on for food and access to other resources has been reduced as a result of climate change and the receding ice cover (Arruda and Krutkowski, 2016).
The collaborative effort of using traditional/Indigenous knowledge and scientific ice prediction data can reduce vulnerability and, at the same time, strengthen Arctic communities resilience and support-capacity to implement, in the field, stronger co-management adaptive strategies in response to climate change. The types of predictions provided by the SIO are relevant to uses of sea ice, but both format and types of variables predicted do not always translate directly into community interests. For example, from a food security perspective, ice qualities and aspects such as ice stability and snow depths are relevant, yet not always captured in remote sensing or prediction systems. Moreover, the use of Indigenous terms and traditional terminology is seen as important in the context of traditional conceptualization and systematization of Indigenous knowledge assessment and analysis.
Here, we share some insights provided by Inupiaq sea-ice experts who contributed to the Sea Ice for Walrus Outlook (SIWO) in spring of 2016, commenting both on unusual sea-ice conditions in the region and their relevance in the context of food security and subsistence activities.
By March 1st, 2016, the shorefast ice off Wales, AK, was reported thinner than normal, owing to mild winter conditions. Based on observations from Winton Weyapuk, Jr. (see the SIZONet observation database, a source of community observations of ice conditions by Indigenous experts), the pack ice was rarely seen off the village throughout March due to both poor visibility from fog and vast amounts of open water in the Strait and toward the southwest.
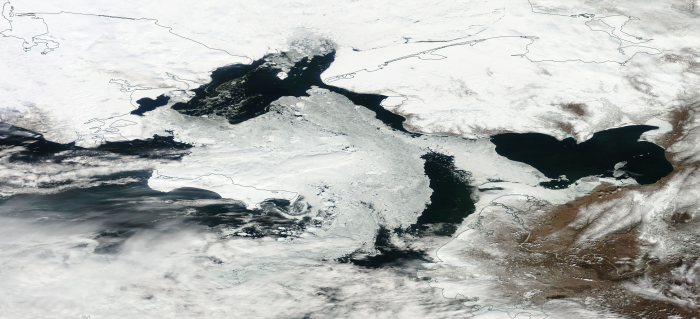
The northeast Bering Sea near Nome and Norton sound experienced an unusually low presence of pack ice throughout most of winter and spring 2016 (see Figure 20). At Nome, Local Environmental Observer Network (LEO) member Anahma Shannon described the unusual conditions of 2016:"I think that this is the first year we've only had shorefast ice. Generally the larger ice pans in the ocean push up against the shorefast ice and sometimes ebb and flow but this is the first time it's been absent more than present. This presented a safety problem for travelers snowmachining between villages or out to their crabbing pots on the ice." (See the full observation post from 18 April 2016 here. - log-in needed for LEO access]
The southern coast of the Seward Peninsula also experienced relatively narrow and absent shorefast ice in certain areas, for example, along the coast between Nome, Port Clarence, and Cape Mountain near Wales. Additionally, the southeast Bering Sea experienced a very late onset of ice formation, with some locations not having seen ice until mid-March. For example at Toksook Bay, LEO Observer Anna John noted that:
"It's February! Middle of the winter. Our bay isn't frozen yet. People usually start jigging for tomcods by this time of the year on the bay. It hasn't been cold enough to freeze the bay….Incredibly, we are fortunate to have more snow this year. Some men are able to go hunting and fishing, to surrounding villages by snowmachines, and there were some people that were able to go to timberline to get wood for maqi (Yupik steam house)..." [See the full observation post from 1 March 2016 here - log-in needed for LEO access.] In recent years, 2013 and 2014, the ice in Toksook Bay was 2-3 feet thick by early March, according to observations from ice expert Simeon John (see observations here under "Tooksok Bay").
During the course of the spring walrus hunt season in the Bering and Chukchi Sea region, mild conditions persisted, with Curtis Nayokpuk from Shishmaref commenting on May 6: "Two weeks ago a seal hunting trip out to the NE found rough, jagged ice up to 8 feet thick. There were no large ridges to anchor the ice, and they found a few flat, 12-inch thick ice sections covered with up to 2 feet of snow. Travel was limited to 3 miles from the shoreline, though one hunter reported finding a path to 7 miles out from Shishmaref and seeing flat sections to continue past that. With open leads 15-20 miles north the forecast for rain and warming temps could melt snow cover and limit travel over the rough ice."
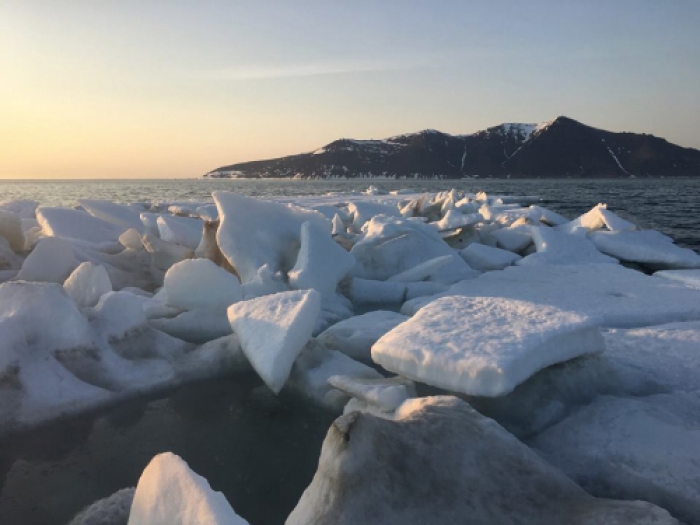
In late May, Bering Strait was largely ice-free (see Figure 20) with hunting crews out of Wales, AK, encountering only remnants of melting ice in the area (see Figure 21).
Such unusually mild or variable ice conditions are part of a broader trend experienced by communities throughout the Arctic. Hunters like Johnassie Ippak, and others who have contributed to the Exchange for Local Observations and Knowledge of the Arctic (ELOKA), travel on sea ice floes to hunt seals, geese, ducks, and whales for food. They have always relied on stable sea ice conditions but their recent field observations on sea ice extent and thickness pointed out to a common conclusion: "The ice is not frozen like it used to be," according to Johnassie Ippak in an interview. In practice, it means that many hunters cannot use their fathers' traditional hunting grounds and routes. In maps on the ELOKA web site, hunters have shown how they altered their hunting routes in response to changing sea ice conditions (Apangalook, et.al., 2013).
Inuits and Sámis have specialized terminology for ice and snow conditions to describe the natural phenomena. This understanding based on the experience of the previous generations has enabled local arctic communities to manage natural resources and survive for thousands of years in the harsh arctic environment in a sustainable way. This cumulative experience from traditional ways of life, shared by cultural experience, consists of a local know-how to observe, predict, use, and conserve natural resources and provide constant adaptation for the sake of future generations. It is the fruit of an intergenerational daily attention to phenomena (such as dangerous ice) in the natural and social environments.
Predicting these fluctuations in the cryosphere is critically important to help avoid uncertainty and improve understanding of ice, ocean, land, and atmospheric processes; enhance the capacity to co-manage natural resources in the Arctic; and advance the prediction systems. There is a clear need for a long-term partnership between science and society.
Probabilistic Assessment of the 2008-2016 Outlooks
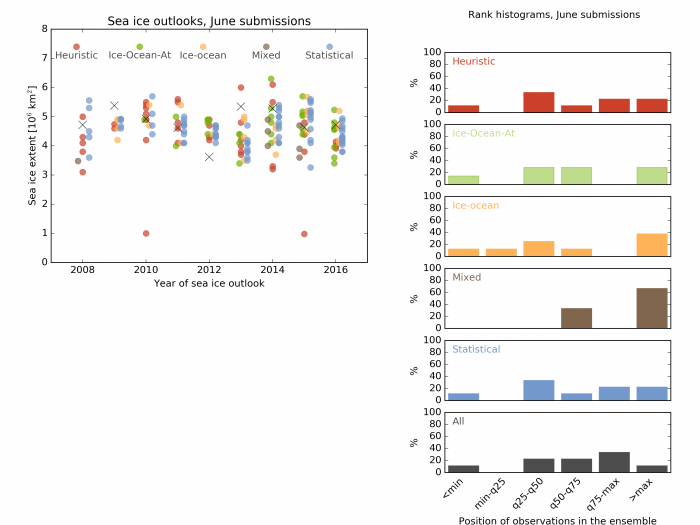
Since 2008, about 600 forecasts have been submitted to the Sea Ice Outlook, all targeting the same diagnostic: the observed September average sea ice extent of the current year. Individual forecasts are generally unable to forecast exactly the observed value, because each forecast is subject to its own errors. However, for a given year and a given submission month, we can group all forecasts into a "super-ensemble" and ask whether this super-ensemble has an appropriate spread. In other words, does the spread of forecasts, taken as a group, reflect correctly the uncertainty in our predictions? With 9 years of data, we can now attempt to investigate this question in a more quantitative way.
The submitted Outlooks are first grouped by type and year (Figure 22, left). To study the spread of the ensemble of forecasts (layered by submission type or even taken all together), we use a very simple tool often quoted in weather community: the rank histogram. The idea is simple: for each year (2008-2016), we first locate the relative position of the observations among the submitted Outlooks. For example, the relative position is 0.5 if the observation lies in the middle of the submissions, and the relative position is negative or greater than 1 if the observation lies outside the range of submissions. Extreme events like 2009, 2012, or 2013 are not necessarily expected to be encompassed by the ensemble, and hence some observations should fall outside or nearly outside the range of submissions.
We then construct the histograms of these relative positions by aggregating the results of all the years (Figure 22, right). Hence, Flat rank histograms (i.e., bars the same height) indicate well-behaved ensembles: neither underdispersive (ensemble spread is so narrow that too many observations fall outside the range) nor overdispersive (ensemble spread is so large that the observations too rarely fall outside the range). In other words, if the histogram is flat, the observations are indistinguishable from the ensemble, and hence statistically compatible with it. By contrast, rank histograms with well defined modes are either underdispersive (tallest bars at the edges of the histogram) or overdispersive (tallest bars at the center of the histogram).
Analysis of the past nine years (Figure 22, right), the ensembles of most types and for all types together have a relatively well-behaved spread. The exception is the mixed type, for which there are too few submissions to give decent statistics. This analysis would benefit from additional years for all types of submissions to draw firmer conclusions.
Lessons Learned in 2016 and Recommendations
After nine years of the SIO, there is still considerable potential to improve sea ice prediction. Suggestions are provided below to do just that and to better assess and compare contributions. Further suggestions from the community are welcome.
- The very low sea ice cover this year from winter to early summer led many teams to forecast low pan-Arctic extent in September too. Many teams adjusted their forecast upward when the weather turned mild in July and August. Near real-time observations in summer were a significant factor in improving forecasts this year.
- To make it possible to evaluate how the forecast error of the SIO ensemble changes from June to August, SIPN should ask those who submit Outlooks in July and August if they have updated their forecast with additional observations since their June submission.
- Sea ice extent in fall of 2016 set record lows as might have been expected given the mechanism relating fall and spring anomalies that has been discussed in the literature (known as re-emergence). The similarity in the spatial pattern of concentration anomalies in spring and fall lends further support to the notion that the fall conditions could have been forecast. The SIO should collect forecasts of fall sea ice, especially in years where spring sea ice is so exceptional.
- The large storms in August this year, in combination with the generally thinner, more mobile ice pack in recent years, caused the sea ice to be less consolidated than in past years. As a result, in September the pan-Arctic extent was relatively high compared to the pan-Arctic area. This outcome points to the need for the SIO to consider other quantities besides pan-Arctic extent, such as pan-Arctic area or full spatial fields, whenever possible.
- The SIO reports should start making some comments on forecast skill for those teams who have submitted forecasts for many years, or for those teams who submit or have published the skill of retrospective forecasts.
- An estimate of baseline skill for the pan-Arctic extent is needed; such an estimate might be damped persistence or the linear trend persistence.
- A variety of methods are used in the literature to assess forecast uncertainty, which makes it difficult to intercompare forecasts skill. Further, if forecasters used common methods and metrics, it would be possible to produce an ensemble mean forecast across the different forecast systems/methods. SIPN should offer advice on which methods/metrics might be best for teams interested in evaluating their forecasting skill.
- Methods for documenting local observations, and linking such observations and Indigenous/local knowledge to forecasts need to be further developed, as well as technical tools to merge and integrate different types of information into predictions in a systematized way.
- It is important to improve mechanisms of access to information. Making the data useful for those that need them locally is essential, through data systems or portals that can be accessed by all the interested stakeholders.
- SIPN has offered long-term SIO data in oral presentations and shared it freely with authors of this post-season report and all who have requested it directly. It would be even better if the data were readily downloadable with documentation.
Report Credits
This post-season report was developed by the 2016 Sea Ice Outlook Action Team, which convened mid-October though December 2016, and Sea Ice Prediction Network Leadership Team. The Action Team was led by SIPN Leadership Team member Cecila Bitz and convened and supported by ARCUS.
Action Team Lead:
Cecilia Bitz; Atmospheric Sciences Department, University of Washington.
Action Team Members:
Gisele Arruda; Oxford Brookes University.
Ed Blockley; Polar Climate Group, Met Office Hadley Centre.
Frank Kauker; Alfred Wegener Institute for Polar and Marine Research.
Alek Petty; NASA Goddard Space Flight Center and University of Maryland.
François Massonnet; Université catholique de Louvain (UCL), Brussels and Catalan Institute of Climate Sciences (IC3, Barcelona, Spain).
Nico Sun; CryosphereComputing.
Additional Contributors:
Matthew Druckenmiller, SEARCH Sea Ice Action Team.
Editors:
Helen Wiggins, ARCUS
Betsy Turner-Bogren, ARCUS
References
Apangalook, L., P. Apangalook, S. John, J. Leavitt, W. Weyapuk, Jr., and other observers. Edited by H. Eicken and M. Kaufman. 2013. The Seasonal Ice Zone Observing Network (SIZONet) Local Observations Interface, Version 1. Boulder, Colorado USA. NSIDC: National Snow and Ice Data Center. doi: doi:10.7265/N5TB14VT.
Arruda, G., Krutkowski, S. (2016) Arctic Indigenous Knowledge, Science and Training in the 21st Century. Journal of Enterprising Communities: People and Places in the Global Economy. Vol. 11, Iss 5, p 52-70.
Goessling, H. and Jung, T. (2017) A probabilistic verification score for contours demonstrated with idealised Arctic ice-edge forecasts, to submitted to Q. J. R. Meteorol. Soc.
Hamilton, L.C., Stroeve, J. (2016) 400 predictions: The SEARCH Sea Ice Outlook 2008–2015. Polar Geography 39(4):274–287. doi:10.1080/1088937X.2016.1234518
Roanne S. van Voorst (2009) I work all the time- he just waits for the animals to come back: social impacts of climate changes: a Greenlandic case study. Jàmbá. Journal of Disaster Risk Studies 2, no. 3 (2009): 235-252.
Spreen, G.; Kaleschke, L.; Heygster, G. (2008), Sea ice remote sensing using AMSR-E 89 GHz channels, J. Geophys. Res.,vol. 113, C02S03, doi:10.1029/2005JC003384.
Zhang, J.; Lindsay, R.; Schweiger, A.; Steele, M. (2013) The impact of an intense summer cyclone on Arctic sea ice retreat , Geophysical Research Letters, 40, 720-726, DOI: 10.1002/grl.50190
