Summary
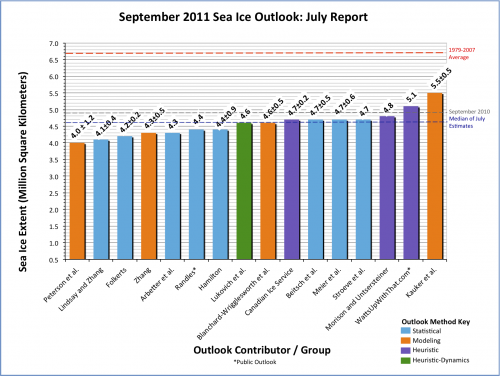
Thank you to all contributors of the July Sea Ice Outlook. We received 16 responses for the Pan-Arctic report (Figure 1), with estimates in the range of 4.0 to 5.5 million square kilometers for the September arctic mean sea ice extent. The median value was 4.6 million square kilometers; the quartile values were 4.3 and 4.7 million square kilometers, a rather narrow range given the intrinsic uncertainty of the estimates on the order of 0.5 million square kilometers. It is important to note for context that all 2011 estimates are well below the 1979–2007 September climatological mean of 6.7 million square kilometers.
There continues to be a consensus for continuation of an anomalously low sea ice extent similar to the values for 2008-2010 and below all previous values before 2007. The data show a continuing low value of sea ice extent at the beginning of the summer season and an appearance of a weather pattern (the Arctic Dipole) that tends to favor summer sea ice loss, in contrast to weak and variable summer winds of previous decades. Ocean changes may also be involved. According to the National Snow and Ice Data Center (NSIDC), arctic sea ice extent for June 2011 was the second lowest in the satellite data record since 1979. These new factors over the last several years seem to be holding the September sea ice extent at persistent low values below 5.0 million square kilometers.
The Regional Outlook can help shed light on the uncertainties associated with the estimates in the Pan-Arctic Outlook by providing more detail at the regional scale. We received 7 regional outlooks. With the exception of the Greenland Sea, all regions are expected to exhibit below-average ice extent throughout the remainder of the season.
This month's Outlook reports also include a more detailed discussion of sea ice thickness information provided from field measurements and model results. This year, several airborne campaigns have collected ice thickness or surface topography data in the North American Arctic. Such surveys can help inform predictions of summer and fall ice conditions.
 values for September 2010 sea ice extent. Credit: Arctic Research Consortium of the U.S. (ARCUS). Click to enlarge.")
Pan-Arctic Outlook
OVERVIEW OF RESULTS
We appreciate the contributions to the July Outlook. We received 16 responses (Figure 1) with estimates in the range of 4.0 to 5.5 million square kilometers for the September arctic mean sea ice extent. The median value was 4.6 million square kilometers and the quartile values were 4.3 and 4.7 million square kilometers, a rather narrow range given the intrinsic uncertainty of the estimates on the order of 0.5 million square kilometers. Eight contributions span the range of 4.4 to 4.7 million square kilometers. The median is nearly the same value as from the June 2011 outlook, 0.2 million square kilometers below the 2010 July Outlook value, and 0.3 million square kilometers below the 2009 July Outlook value. It should be recalled that we are comparing these Outlook values to the September average sea ice extent as provided by the National Snow and Ice Data Center (NSIDC). NSIDC is not the only data source for ice extent; we use their value as an operational definition. If other data sources for sea ice extent are used, the corresponding mean monthly ice extent values can be adjusted by an offset to roughly correspond to the NSIDC value.
There continues to be a consensus for continued anomalously low sea ice extent similar to the values for 2008-2010 and below all previous values before 2007. If the observed 2011 sea ice extent is in the range of 2008-2010 values, similar to the 2011 Outlook projections, it would point towards the absence of "tipping point" behavior after the record minimum of 2007, but would not indicate a return to the previous state observed prior to 2007. The data from 2011 shows a continuing low value of sea ice extent at the beginning of the summer season and an appearance of the Arctic Dipole weather pattern with southerly winds that tends to favor summer sea ice loss, in contrast to weak and variable summer winds of previous decades. Ocean changes may also be involved. These new factors over the last several years seem to be holding the September sea ice extent at persistent low values below 5.0 million square kilometers.
JUNE 2011 ICE AND ATMOSPHERIC CONDITIONS
The ice extent through May and June was at or below previous record sea ice extents from 2007 and 2010, and converges towards both values at the beginning of July (Figure 2). According to the National Snow and Ice Data Center (NSIDC), arctic sea ice extent for June 2011 was the second lowest in the satellite data record since 1979. Sea ice extent was lower than normal in much of the Arctic, and the Kara Sea region had particularly low ice extent. Ice has also started to break up off the coast of Alaska in the Chukchi and Beaufort Seas. These early open water areas absorb the sun's energy, which will help to further ice melt through the summer.
.")
Normally (i.e., before 2007) light winds prevail during summer in the Arctic. However, throughout the summer of 2007, the persistence of the Arctic Dipole Anomaly (AD) sea level pressure pattern, with high pressure on the North American side and low pressure on the Siberian side, contributed substantially to the record low ice extent in September 2007. In June 2011, similar to June 2010, the AD was present in early summer (Figure 3), but in 2011 the pattern is shifted toward the Siberian coast. This is consistent with developing early sea ice losses along the Siberian coast and the Kara Sea.
 for June 2011 showing an Arctic Dipole (AD) pattern over the central Arctic Ocean, but with stronger pressure gradients shifted toward the Siberian side.")
ICE THICKNESS IN THE NORTH AMERICAN AND GREENLAND ARCTIC
The importance of the ice thickness field in controlling summer ice evolution has been well established, including by contributions to the Sea Ice Outlook in past years from ensemble simulations with coupled ice ocean models (Kauker et al., Zhang et al.). This year, several airborne campaigns, including the German-Canadian-US collaborative effort PAMARCMIP (see Figure 4), the NASA IceBridge flights, and others have collected ice thickness or surface topography data in the North American Arctic. Figure 4 shows a comparison between this data and model output by Kauker et al. used in their September ice extent prediction. It is noteworthy that the model over-predicts ice thickness along the North American and Greenland shelf margin. It is not clear whether this difference is also connected to the comparatively high prediction for September ice extent by Kauker et al.'s group; the October retrospective analysis will provide more insight into that question. However, it does appear that the band of thick ice north of the Canadian Archipelago and Greenland has further thinned (see also Figure 5). At the same time, the ice in the Beaufort and Chukchi Seas is seeing less multiyear ice drifting in from the Canadian Arctic, with more first-year ice prevalent in 2011 than in past years. As discussed in the Regional Outlook, this has implications for the summer ice season in the region. Overall, while we are lacking ice thickness data over the central Arctic (though with Cryosat in orbit this will change soon: http://www.esa.int/esaCP/SEMAAW0T1PG_index_0.html), there is some indication that the regions of the thickest ice may have seen further thinning. However, at present it is unclear whether any of this will manifest itself in milder ice conditions this year, since the ice with thicknesses well above 2 m (where the biggest changes have occurred) will not melt out completely.
. Shown at bottom is the output from the NAOSIM coupled ice ocean model for 14 April 2011. The model simulation does not contain assimilated ice thickness data and shows significant differences in particular in the region north of Greenland. Provided by F. Kauker, OASYS/AWI.")
 for Lincoln Sea transects in Figure 4 (region north of Canada and Greenland) for 2011 and 2009. Note that 2011 thicknesses of multiyear and deformed first-year ice are lower both with respect to the ice thickness mode and the distribution of thick ice. Provided by S. Hendricks and C. Haas.")
2011 NORTHERN SEA ROUTE THROUGH SIBERIAN ARCTIC OPENED FOR ICEBREAKER-ESCORTED SHIPPING
On the 30 June the 2011 Northern Sea Route (NSR) "opened" for icebreaker-escorted sea transit along the northern shore of Russia. The nuclear powered icebreaker NS Yamal, with shark's teeth painted on her bows, left Murmansk to rendezvous with the oil tanker MV Perseverance and escort her along the NSR to her China destination. This year the arctic sea ice is melting so rapidly that the NSR is opening earlier than ever. Updated from: http://articles.maritimepropulsion.com/article/2011-Northern-Sea-Route-….
CHANGES IN OCEAN HEAT TRANSPORT ON THE ATLANTIC SIDE?
The temperatures of North Atlantic Ocean water flowing north into the Arctic Ocean—the warmest water in at least 2,000 years—are likely related to the amplification of global warming in the Arctic. The Fram Strait water temperatures today are about 2.5 degrees F warmer than during the Medieval Warm Period. http://dirwww.colorado.edu/news/r/9059018f4606597f20dc4965fa9c9104.html
KEY STATEMENTS FROM INDIVIDUAL OUTLOOKS
Key statements from the individual Outlook contributions are below, summarized here by author, organization of first author, Outlook value, standard deviation/error estimate (if provided), method, and abstracted statement. The statements are ordered from highest to lowest outlook values. The full individual contributions are available in the "Pan-Arctic Individual PDFs" section at the bottom of this webpage, and provide more detail.
Kauker et al. (Alfred Wegener Institute for Polar and Marine Research); 5.5 ± 0.5; Model
For the present outlook the coupled ice-ocean model NAOSIM has been forced with atmospheric surface data from January 1948 to June 22, 2011. This atmospheric forcing has been taken from the NCEP/NCAR reanalysis (Kalnay et al., 1996). We used atmospheric data from the years 1991 to 2010 for the ensemble prediction. The model experiments all start from the same initial conditions on May 22, 2011. We thus obtain 20 different realizations of sea ice development in summer 2011. We use this ensemble to derive probabilities of ice extent minimum values in September 2011.
WattsUpWithThat.com (Public Contribution-Poll); 5.1; Heuristic
Website devoted to climate and weather polled its readers for the best estimate of 2011 sea ice extent minimum by choosing bracketed values from a web poll (http://wattsupwiththat.com/2011/06/26/july-arcus-forecast-poll-what-wil…). 15.38% chose 5.0 to 5.1 million km2, with second greatest vote of 11.17% choosing 5.4 to 5.5 million sq km2.
Morison and Untersteiner (Polar Science Center, APL-UW); 4.8; Heuristic
The ice extent was below the extent at the same time in 2007 but is now even with 2007. As we argued in June, if loss rates don't become anomalously large in the next couple of months, the ice extent should be a little greater than the extent in 2007.
Stroeve et al. (National Snow and Ice Data Center); 4.7; Statistical
This estimate uses the same approach as last year: survival of ice of different ages based on ice age fields provided by Chuck Fowler and Jim Maslanik (Univ. Colorado, Boulder). However, this year we are using a revised ice age product, one based on a 15% sea ice concentration threshold rather than the earlier version, which used a threshold of 40% [see Maslanik et al., in review for more details]. The use of a 15% threshold on sea ice concentration captures greater detail within the marginal ice zone, matches NSIDC's threshold used for mapping overall sea ice extent and should therefore provide a better estimate of the September 2011 ice extent.
Meier et al. (National Snow and Ice Data Center); 4.7 ± 0.6; Statistical
This statistical method uses previous years' daily extent change rates from July 1 through September 30 to calculate projected daily extents starting from June 30. The September daily extents are averaged to calculate the monthly extent. Rates from recent years are more likely to occur because of the change in ice cover. Thus, the official project is based on the rates for 2002-2010.
Beitsch et al. (University of Hamburg); 4.7 ± 0.5; Statistical
The estimate is based on AMSR-E sea ice concentration data derived using the ARTIST sea ice (ASI) algorithm (Spreen et al., 2008; Kaleschke et al., 2001). To obtain an estimate, the ice area from a central Arctic subregion is regressed with the previous years and their September mean extents. Daily updates can be found here: http://icdc.zmaw.de/cryosphere.html?&L=1
Note (7/13): During the past few days, the estimate dropped to a value of 4.1 +- 0.2 Mio km.
Canadian Ice Service; 4.7 ± 0.2; Heuristic
Since Arctic multi-year ice (MYI) did not experience free passage through Nares Strait throughout the winter of 2011 as it did in 2007 and 2010, a normal concentration of MYI currently exists in the Lincoln Sea area and north of Ellesmere Island at the beginning of July 2011. This factor may be just enough to prevent record-breaking minimum ice concentrations and extents in the Arctic Ocean in 2011.
Blanchard-Wrigglesworth et al. (University of Washington); 4.6 ± 0.5; Model
Our forecast uses a state-of-the-art General Circulation Model (GCM) initialized with average May 2011 sea ice area and volume anomalies obtained from the Pan-arctic Ice-Ocean Modeling and Assimilation System (PIOMAS). The GCM used is the National Center for Atmospheric Research (NCAR)'s Community Climate System Model version 4 (CCSM4) [1] at 1_ resolution in all components.
Lukovich et al. (Centre for Earth Observation Science, U. of Manitoba); 4.6; Heuristic-Dynamics
Spatial patterns in difference maps for springtime stratospheric relative vorticity and winds in 2011 relative to 2007 highlight a westward shift in anticyclonic/cyclonic circulation and significant differences over the Beaufort Sea and Canadian Archipelago, with implications for stratosphere-surface coupling and thus surface winds in this region. A combined lack of coherence in ice drift fields and reduced ice concentrations in April 2011 relative to April 2007 suggest that springtime ice dynamical contributions to fall sea ice extent may be associated with sea ice deformation and ridging within an increasingly mobile and fractured ice cover.
Hamilton (University of New Hampshire); 4.4 ± 0.9; Statistical
This is a naive, purely statistical model. It predicts September mean extent simply from a Gompertz curve representing the trend over previous years. Estimation data are the NSIDC monthly mean extent reports from September 1979 through September 2010.
Randles; 4.4; Statistical
A Gompertz fit of the NSIDC September extent figures is used as a starting point. Multiple linear regression is then used to predict the residual from the Gompertz fit. Two predictors have been used which are:
a) The residual of the end of June Cryosphere Today area numbers at the end of June from a Gompertz fit of those end of June area numbers.
b) The residual of the end of June PIOMAS volume numbers at the end of June from a Gompertz fit of those end of June volume numbers.
Arbetter et al. (National Ice Center) 4.3; Statistical
In the July update, using sea ice conditions from the end of May (June used end of April) as well as air temperatures and sea level pressures, the timing of the minimum is moved forward two weeks, although the value remains the same as before. This is because the update predicts slightly lower ice extent through July and August, which does not decelerate until the second week of September, rather than the first as in the June Outlook. The minimum forecast value may be constrained by observations. That is, since the projection is based on the previous 10 years' observations, the value can be no higher than the highest ice amount and no lower than the lowest ice amount in the past 10 years. The forecasts so far are robust in predicting close to near-record minimums. It must also be noted that the Outlook does not project conditions in the Canadian Archipelago; it has not been determined how much lower the ice extent is because of this. Since the July Outlook also suggests a delayed refreezing of the ice compared to June, the possibility exists that a record low could be seen. In 2010, the July Outlook was the lowest projected value and too low compared to the actual value. A thorough re-examination of ARIFS over the past 10 years could better characterize error in the model.
Zhang (Applied Physics Lab, University of Washington); 4.3 ± 0.5; Model
This is based on numerical ensemble predictions starting on 7/1/2011 using the Pan-arctic Ice-Ocean Modeling and Assimilation System (PIOMAS). The ensemble consists of seven members each of which uses a unique set of NCEP/NCAR atmospheric forcing fields from recent years, representing recent climate.
Folkerts 4.2± 0.2; Statistical
Various single and multiple regression results with r2 > 0.6 suggest that the September extent will be close to, or perhaps below, the minimum value set in 2007. Analyses based on extent, area, and volume.
Lindsay and Zhang; 4.1 ± 0.4; Statistical
This is quite a bit lower than the prediction from last month.
Peterson et al. (UK Met Office); 4.0 ± 1.2; Model
This projection is an experimental prediction from the UK Met Office seasonal forecast system, GloSea4 (Arribas et al., 2011). GloSea4 is an ensemble prediction system using the HadGEM3 coupled climate model (Hewitt et al., 2011). A more complete description of the GloSea4 system can be found in the June report and accompanying references (http://www.arcus.org/files/search/sea-ice-outlook/2011/06/pdf/pan-arcti…)
| Attachment | Size |
|---|---|
| arbetter_etal_panarctic_july.pdf279.36 KB | 279.36 KB |
| beitsch_etal_panarctic_july.pdf3.17 MB | 3.17 MB |
| blanchard_etal_panarctic_july.pdf2.53 MB | 2.53 MB |
| canadian_ice_service_panarctic_july.pdf78.76 KB | 78.76 KB |
| folkerts_panarctic_july.pdf42.75 KB | 42.75 KB |
| hamilton_panarctic_july.pdf170.43 KB | 170.43 KB |
| kauker_etal_panarctic_july.pdf155.8 KB | 155.8 KB |
| lindsay_zhang_panarctic_july.pdf34.66 KB | 34.66 KB |
| lukovich_etal_panarctic_july.pdf553.76 KB | 553.76 KB |
| meier_etal_nsidc_panarctic_july.pdf233 KB | 233 KB |
| morison_untersteiner_panarctic_july.pdf28.01 KB | 28.01 KB |
| peterson_etal_panarctic_july.pdf318.36 KB | 318.36 KB |
| randles_panarctic_july.pdf102.8 KB | 102.8 KB |
| stroeve_etal_nsidc_panarctic_july.pdf195.13 KB | 195.13 KB |
| wuwt_panarctic_july.pdf49.81 KB | 49.81 KB |
| zhang_panarctic_july.pdf168.24 KB | 168.24 KB |
| Attachment | Size |
|---|---|
| gerland_etal_regional_july.pdf640.8 KB | 640.8 KB |
| gudmandsen_regional_july.pdf1.19 MB | 1.19 MB |
| howell_regional_july.pdf540.42 KB | 540.42 KB |
| lindsay_zhang_regional_july.pdf336.54 KB | 336.54 KB |
| petrich_etal_regional_july.pdf57.54 KB | 57.54 KB |
| tivy_regional_july.pdf703.68 KB | 703.68 KB |
| zhang_regional_july.pdf206.12 KB | 206.12 KB |