
Outlook Report
Executive Summary
Once again, we express our thanks to all groups and individuals who submitted their contributions to the June 2022 Sea Ice Outlook (SIO) report. We appreciate your continuing efforts to support our annual activities amid these difficult times and your busy schedules.
We received 37 contributions of September sea-ice extent that included pan-Arctic forecasts; of these, ten included predictions for the Alaska region (Bering, Chukchi, and Beaufort seas) and nine included predictions for pan-Antarctic. This year's median forecasted value for pan-Arctic September sea-ice extent is 4.57 million square kilometers with quartiles of 4.34 and 4.90 million square kilometers. This is higher than the SIO forecasted value of September sea-ice extent for the past three years (2019–2021), but slightly below the median value of 4.60 million square kilometers cited by 2018 SIO June report. The lowest sea-ice extent forecast is 3.41 million square kilometers, and the highest sea-ice extent forecast is 5.20 million square kilometers.
For the Alaska regional sea-ice extent, forecasts from six statistical methods and four dynamical model forecasts show differences. The dynamical model forecasts range from 0.53 to 0.97 million square kilometers with a median of 0.76 million square kilometers. The statistical model forecasts range from 0.33 to 0.63 million square kilometers with a median of 0.55 million square kilometers. To place these in historical perspective, the September median sea-ice extent for the averaged Alaska seas (Bering, Chukchi, and Beaufort) over 2007–2021 was 0.40 million square kilometers
For Antarctic sea ice, six of the nine submissions used statistical/machine learning methods, and three employed dynamical models. This year, a striking feature is the narrow spread in the forecasts compared to previous years: for the first time, the forecast range (1.39 million square kilometers) is smaller than the observed range (2.08 million square kilometers). In 2017–2021, the range (min-max) of the ensemble of forecasts often exceeded twice the range of observed historical records. The median value of forecasted September Antarctic sea-ice extent is 18.37 million square kilometers. It is thus expected that September sea-ice extent will be below the climatological average.
For the second year, we solicited September mean sea-ice extent anomalies. The 16 forecasts range from -0.81 to +0.80 million square kilometers, with 12 forecasts above and four below the contributors' baseline anomalies. As in past years, we invited forecasts of September sea-ice probability (SIP), ice-free dates (IFD) and forecast initial conditions. For the June 2022 SIO, we received eight SIP forecasts and five IFD forecasts, and two models shared the forecasts' initial conditions of sea-ice concentration and sea-ice thickness. This is a smaller number of contributions compared to last year. Based on the SIP forecast, The Northeast Passage is highly likely to be open in the summer, although there is uncertainty.
This year, we re-arranged our report structure. The first section includes discussions of forecasts of September mean sea-ice extent (Pan-Arctic, Sea-Ice Extent Anomalies, Alaska Region, Spatial Forecast, and Antarctic). Current Conditions are discussed in the second section, and a discussion of Predicting Predictions is in the third section. An overview of ocean heat conditions is not included in our June report, but will be presented in the July report.
This June Outlook Report was developed by lead authors Muyin Wang, University of Washington (Executive Summary, Overview, and discussion of Current Conditions) and James Overland, NOAA Pacific Marine Environmental Laboratory (PMEL; Overview and discussion of Current Conditions); with contributions from Edward Blanchard-Wrigglesworth, University of Washington (Predictions from Spatial Fields Discussion); Uma Bhatt, University of Alaska Fairbanks (Discussion of pan-Arctic anomaly sea-ice forecasts and ice conditions in the Bering and Chukchi seas); François Massonnet, Université catholique de Louvain (Antarctic Contributions Discussion and Predicting Predictions); Matthew Fisher and the NSIDC Development Team, (statistics and graphs); Betsy Turner-Bogren, Helen Wiggins, Kuba Grzeda, Lisa Sheffield Guy, and Stacey Stoudt, ARCUS (report coordination and editing); and the rest of the SIPN2 Project Team.
Note: The Sea Ice Outlook provides an open process for those who are interested in Arctic sea ice, to share predictions and ideas; the Outlook is not an operational forecast.
See June Call for Contributions
2022 SIO Forecasts (Pan-Arctic, Alaska Region, Spatial Forecasts, and Antarctic)
Pan-Arctic Sea-Ice Forecasts
There are 37 Arctic June Outlook contributions for the September 2022 sea-ice extent (Figure 1). There were four contributions using a heuristic or qualitative analysis approach (same as in 2021), 21 contributions using statistical/machine learning (ML) methods (two fewer than 2021), and 11 using dynamical models (i.e., based on fluid dynamics equations; one more than 2021), and one by mixed methods (which is a dynamic ensemble forecast with bias correction using previous year's error estimate). This year's median forecasted value is 4.57 million square kilometers with quartiles of 4.34 and 4.90 million square kilometers. This is higher than the SIO forecasted value of September sea-ice extent for the past three years (2019–2021), but slightly below the median value of 4.60 million square cited in the 2018 SIO June report. The lowest forecast is 3.41 million square kilometers. Among the four methods that forecast September extent less than four million square kilometers, three are based on dynamical models. Two contributions forecast a record low extent (below 3.57 million square kilometers set in 2012). The highest forecast is 5.20 million square kilometers. Among the five methods that project September sea-ice extent more than five million square kilometers, four are based on statistical/ML methods.
This year, the statistical method and the machine learning methods are combined into a single category. The spread in the statistical/ML method and the heuristic methods is smaller compared to the dynamical models. The median forecast for heuristic, statistical/ML, and dynamical models are: 4.38, 4.71, and 4.56 million square kilometers, respectively. The first and third quartiles for each group are: 4.09 and 4.55 million square kilometers (heruistic), 4.50 and 4.97 million square kilometers (statistical/ML), and 4.04 and 4.82 million square kilometers (dynamical), respectively.
Ten groups submitted supplemental materials (See: Contributor Full Reports and Supplemental Materials below). The contents vary among the contributions but they may include information on: (1) how the forecasts are produced, (2) number of ensemble members used, (3) whether and how bias-corrections are applied, (4) the ensemble spread and range, uncertainties and other statistics, and (5) whether or not post-processing was performed.

 is 4.38 (Heuristic), 4.71 (Statistical/ML), and 4.56 (Dynamical). The single value for the mixed method is 4.85. Image courtesy of Matthew Fisher, NSIDC.")
This is the second year that the SIO has solicited forecasts of September mean sea-ice extent anomalies. The pan-Arctic anomaly is the departure of the contributors' September extent Outlook relative to their adopted baseline trend (e.g., the trend in historical observations, model hindcasts, etc.), motivated by the prospect of reducing SIO extent forecast uncertainty that may originate from models having different trends, mean states, and post-processing methodologies. The 16 anomaly forecasts range from -0.81 to +0.80 million square kilometers, with 12 above and four below the contributors' baseline (Figure 3). For historical perspective, observed anomalies relative to the linear trend over the 2005–2020 period are shown in Figure 4. The observed anomalies range from -1.22 (2012) to 0.74 (2006) million square kilometers. The June SIO anomaly forecast range spans 1.6 million square kilometers, which is within the observed range (2004–2021)of 1.8 million square kilometers (with the exception of 2012). This suggests that uncertainty is not significantly reduced by the anomaly forecasts some models forecast above 'model normal' sea-ice extent and others below. We note that the anomaly forecast could potentially be reduced using a more constrained definition of anomalies for the SIO. The pan-Arctic June SIO anomaly forecast has a median of 0.17 and a standard deviation of 0.44 million square kilometers.

 and anomaly from a linear fit over the 2005–2020 period (right) in millions of square kilometers.")
Alaska Regional Forecasts
The multimodal median for the June 2022 SIO forecast for the Alaska seas is 0.55 million square kilometers, and values range from 0.33 to 0.97 million square kilometers (Figure 5). The dynamical model forecasts range from 0.53 to 0.97 million square kilometers with a median of 0.76 million square kilometers. The statistical model forecasts range from 0.33 to 0.63 million square kilometers with a median of 0.55 million square kilometers. The statistical forecasts display a smaller spread (standard deviation of 0.10) compared to the dynamical models (standard deviation of 0.25) (Figure 6). To place these in historical perspective, the September median sea-ice extent for the averaged Alaska seas (Bering, Chukchi, and Beaufort) over 2007–2021 is 0.40 million square kilometers (Figure 7), making the forecast for 2022 above all observed values between 2015 and 2020.


 and SIO median June forecast (red solid square). The 2022 June median forecast is shown by the red open box. A cubic fit is shown in black.")
Pan-Arctic Forecasts with Spatial Methods
As in past years, we invited forecasts of September sea-ice probability (SIP), ice-free dates (IFD), and forecast initial conditions. SIP is defined as the fraction of ensemble members that project September ice concentration in excess of 15% (for example, if just four out of eight ensemble members are higher than 15% concentration, the SIP is 50%). IFD is the first date in the melt season at which the ice concentration at a given location drops below a certain threshold (we use 15% SIC and 80% SIC thresholds). For the June 2022 SIO, we received eight forecasts of SIP and five of IFD (Figure 8).
As in previous years, there is significant uncertainty in SIP forecasts in the Laptev/East Siberian and northern Chukchi seas. All show 100% probabilities of open water along the Alaskan, mainland Canada, and east Siberian coastlines. The Northeast Passage is highly likely to be open, although there is some uncertainty.
.")
Figure 9 shows IFD with 15% ice concentration cut-off (IFD15; top row) and 80% ice concentration cut-off (IFD80; bottom row) forecasts. The IFD15 forecasts north of the Arctic basin coastlines, with an uncertainty over one month in the Kara, Laptev, East Siberian, Chukchi, and Beaufort seas. In contrast, for IFD80, most uncertainty is within the central basin, with some contributions forecasting SIC falling below 80% in July or August (AWI and IAP LASG). Others forecast that SIC will remain above 80% throughout the summer (e.g., Sun and RASM).
 forecast for IFD15 (top row) and IFD80 (bottom row).")
While only two groups (models RASM and AWI) shared initial conditions of sea-ice concentration (SIC) and sea-ice thickness (SIT), both were initialized with similar SIC, but SIT showed greater spread. These patterns were also noted in prior SIO years across a larger number of models (Figure 10).

Antarctic Forecasts
Nine groups submitted June forecasts of September mean Antarctic sea-ice extent. Six groups used statistical or machine learning methods and three used dynamical model approaches. A striking feature is the low spread compared to previous years. In 2017–2021, the range (min-max) of the ensemble often exceeded twice the range of observed historical records. This year—and for the first time—the range in forecasts (1.39 million square kilometers) is smaller than the observed range (2.08 million square kilometers). The large range of previous years was caused by dynamical model forecasts. The Met Office forecast applies a bias correction. As far as we know, the two EMC forecasts do not apply a bias correction.
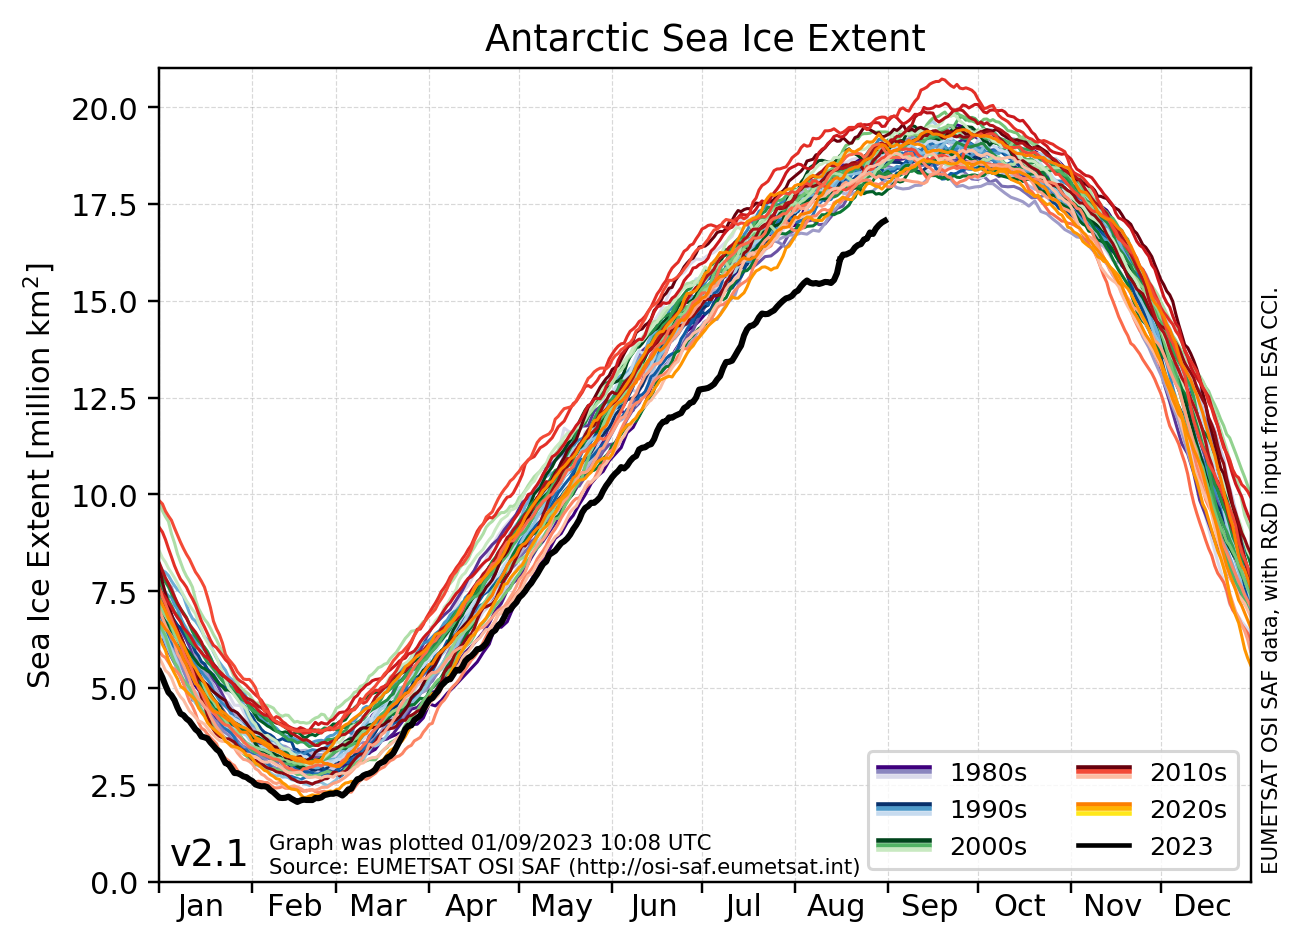
Also shown are two "trivial" forecasts, the climatology (1979–2021 mean sea-ice extent) and the anomaly persistence (May 2022 anomaly added to September 1979–2021 mean forecasts. Taking into account these indicators, the SIO June ensemble, and that as of this report, Antarctic sea ice is tracking record lows (see, e.g., the EUMETSAT plot of Antarctic Sea Ice Extent), September sea-ice extent will likely be below climatological averages.
 compared with the observed value for the period 1997–2021 (thick blue lines). The dark square and star denote the climatological and persistence forecast based on the historical data.")
Current Conditions
Pan-Arctic Conditions
Despite above average (the 1981–2010 mean condition) at the beginning of the 2022, by the start of the melt season the ice extent was similar to 2021 and not unusual compared to extents over the last decade (Figure 12, NSIDC). By 14 June 2022, extent was lower than the 1981–2010 median most everywhere except within the Beaufort Sea (Figure 13). The most notable features are the large, open water areas within the Barents Sea, and low concentrations along the Siberian and Greenland coasts.
Near surface air temperature anomalies for winter-spring (Jan-May; Figure 14) were strongly positive in all months in an area centered north of the Canadian Arctic, but positive values were the rule across the central Arctic Ocean. Steering level winds of the springtime jet stream (light purple band; Figure 15) have been from the west in the North Atlantic, bringing warm conditions and early ice-melt in the Barents Sea. Further, winds across the pole from Siberia to northern Canada support the warm temperature feature in Figure 14, while sea-ice advection helped to maintaine the high sea-ice concentration in the region, despite its being under the warm air maximum (Figure 13).
, and interdecile range (light gray shading) as well as recent years (2007: cyan, 2012: red, and 2021 dark green).")
. Figure courtesy of the National Snow and Ice Data Center, University of Colorado, Boulder")

Note: Image provided by the NOAA/ESRL Physical Sciences Laboratory, Boulder Colorado from the PSL NOAA website.

Note: Image provided by the NOAA/ESRL Physical Sciences Laboratory, Boulder Colorado from the PSL NOAA website.
The ice thickness anomaly map (Figure 16) for April 2022 relative to 2011–2020 divides the Arctic in two halves with positive anomalies in the western Arctic and negative anomalies in eastern Arctic. A narrow band of negative anomalies remains along the coast of north Greenland, but a positive anomaly exists north of Baffin Island. Note that the positive anomaly north of Baffin Island is not apparent in the CryoSat-2 ice thickness anomaly map, although there is agreement about the thicker ice in the eastern Beaufort Sea.

Note: Image from the Polar Science Center.
Looking forward, the 1–15 June 2022 sea-level pressure map (Figure 17) has high pressure over the entire Arctic Ocean. This suggests little temperature advection contribution to continued sea-ice loss, but contributions from clearing skies. Winds from the east are seen along the coast of Alaska.
 averaged over 1–15 June 2022")
Note: Image provided by the NOAA/ESRL Physical Sciences Laboratory, Boulder Colorado from the PSL NOAA website.
Alaska Regional Conditions
Mid-June sea-ice extent in the Alaska seas in 2022 is, so far, similar to those in 2021 (Figure 18, left): sea ice is retreating in the Chukchi Sea while the Beaufort remains ice-covered. The combined Bering, Chukchi, and Beaufort sea-ice extent since mid-April 2022 is slightly lower than the 1981–2010 average (Figure 18, right). The retreat during mid-April to mid-May was faster than the long-term median (black line in Figure 18, right), but slowed in the first half of June 2022. The 14 June 2022 sea-ice extent in the Alaska seas was 1.69 million square kilometers and is similar to this day in 2021. The 2022 extents are slightly below the 1981–2010 median of 1.73 million square kilometers and above the 14 June 2019 sea-ice extent of 1.32 million square kilometers, which was the lowest on the record.
 for 15 June 2022. Right: Daily seasonal cycle of sea-ice extent in the Alaska seas (Bering+Chukchi+Beaufort) for select years and the climatological median for 1981–2010.")
Predicting Predictions
Looking back at the 14-year record of all June sea-ice outlooks (Figure 19), there is a striking lack of correspondence between the median of all outlooks and the actual September observed value: the two time-series correlate at only r = 0.21. Hamilton and Stroeve (2016) proposed that while we are able to forecast the forced changes in sea-ice extent (i.e., values close to the trend-line or the local average), predicting anomalous conditions such as in 2012 or 2013, remains extremely difficult. During years for which the September sea-ice extent departs significantly from the previous year's value, errors tend to be larger (Fig. 5 of Hamilton and Stroeve 2016), which supports this idea.
 and SIO June forecast median (yellow line with squares).")
While the correlation between forecasted and observed time-series is low, there are hints from Figure 19 that the two time-series exhibit one-year lagged co-variability—the correlation increases greatly (r = 0.86) when introducing a one-year lag difference. That is, the observed September extent of a given year is a very good predictor of the Sea Ice Outlook prediction issued the next year (Figure 20).
Based on this relationship, we predicted in October 2021 (after the September 2021 observed value was available) that the median forecast for June 2022 would be 4.65 +/- 0.23 million square kilometers (90% confidence prediction interval). The actual June SIO median (4.57 million square kilometers) falls inside this confidence interval.
How can we explain this relationship? A possibility is that, as a crowd, the community providing SIO outlooks keeps a "memory" of how anomalous the previous year was. For example, after the 2012 record minimum, several groups may have updated their forecasting system (consciously or not) because observing such a low value became a distinct possibility. While this behavior is justified, a worrying reality is that the observed September sea-ice extent anomalies do not exhibit significant one-year memory (r = 0.03 for the one-year lagged 2007–2021 observed time-series), so that using last year's observed value as an outlook for next year is equivalent to contributing a climatological forecast.
One might think that the association seen in Figure 20 is driven by a subset of forecasts. That is not the case: a relationship exists in dynamical (r = 0.77), statistical (r = 0.79) and to a lesser extent hybrid (r = 0.41) contributions. The "mixed" category does not offer enough data points to compute reliable statistics.
An interesting test for this relationship would be to observe, in September 2022, a large deviation (positive or negative) in observations from the trend-line, and to see if the 2023 sea-ice outlooks would follow this deviation, as that was in 2013 (following 2012) and 2014 (following 2013; Fig. 19).
 vs the Sea Ice Outlook June median prediction at next year (y-axis). The two-digit numbers in each data point refer to the year considered (e.g., "15" = 2015).")
References
Hamilton, L. C. & J. Stroeve. 2016. 400 predictions: The SEARCH Sea Ice Outlook 2008–2015. Polar Geography doi: 10.1080/1088937X.2016.1234518
Contributor Key Statements, Summary of Uncertainties
![]() Summary Table of Key Statements from Individual Outlooks (PDF - 152 KB)
Summary Table of Key Statements from Individual Outlooks (PDF - 152 KB)
Contributor Full Report PDFs and Supplemental Material
This report was developed by the SIPN2 Leadership Team
Report Leads
Muyin Wang, University of Washington and the Joint Institute for the Study of the Atmosphere at the University of Washington
Jim Overland, NOAA/Pacific Marine Environmental Laboratory
Additional Contributors:
Matthew Fisher and the NSIDC Development Team, Cooperative Institute for Research in Environmental Sciences at the University of Colorado Boulder, NSIDC
Editors:
Betsy Turner-Bogren, ARCUS
Helen Wiggins, ARCUS
Kuba Grzeda, ARCUS
Stacey Stoudt, ARCUS
Lisa Sheffield Guy, ARCUS
Suggested Citation:
Wang, M. and Overland, J.E., U.S. Bhatt, P. Bieniek, E. Blanchard-Wrigglesworth, H. Eicken, M. Fisher, L. C. Hamilton, J. Little, F. Massonnet, W. Meier, M. Serreze, M. Steele, J. Stroeve, J. Walsh, and H. V. Wiggins. Editors: Turner-Bogren, B., L., Sheffield Guy, J.K. Grzeda, S. Stoudt, and H. V. Wiggins. June 2022. "Sea Ice Outlook: 2022 June Report." (Published online at: https://www.arcus.org/sipn/sea-ice-outlook/2022/june.)
This Sea Ice Outlook Report is a product of the Sea Ice Prediction Network–Phase 2 (SIPN2), which is supported in part by the National Science Foundation under Grant No. OPP-1748308. Any opinions, findings, and conclusions or recommendations expressed in this material are those of the author(s) and do not necessarily reflect the views of the National Science Foundation.