Outlook Report
Executive Summary
We thank those dedicated participants who contributed to this 2023 September Sea Ice Outlook (SIO) report and all the reports for this year. The 2023 September Sea Ice Outlook received 22 submissions (29 in August, 30 in July, 38 in June). These outlook contributions are based on various methods, including dynamical (physics-based) models, statistical approaches including machine-learning (ML), and heuristic (qualitative). Along with projections of total Arctic sea-ice extent for September, the September SIO received five projections of Antarctic total ice extent (nine in each June, eight in July, and seven in August SIOs) and nine projections of ice extent in the Alaskan sector, which combines the Bering, Chukchi, and Beaufort seas (ten in the August and June SIOs and nine in the July SIO). Sea-ice probability (SIP) forecasts from six models are included in the September 2023 SIO. For the third year, the SIO solicited September mean Arctic sea-ice extent anomaly forecasts and received 12 in September (13 in the August SIO, and 15 in the June and July SIOs).
The pan-Arctic September Outlook median forecast value for September 2022 sea-ice extent is 4.50 million square kilometers, with lower and upper quartile values 4.2 and 4.61 million square kilometers, respectively. The median of the September 2023 submissions is less than that from August (4.60 million square kilometers), July (4.66 million square kilometers), and June (4.54 million square kilometers) of 2023.
Based on the National Snow and Ice Data Center (NSIDC) Sea Ice Index (SII), the Arctic sea-ice extent index is 4.22 million square kilometers, as of 16 September 2023. As of mid-September, ice extent was lower than the 1980–2010 average in nearly all sectors of the Arctic Ocean and particularly in the Amerasian basin (Beaufort, Chukchi, and E. Siberian Seas). Further information about current conditions can be found at National Snow and Ice Data Center's Arctic Sea Ice News & Analysis.
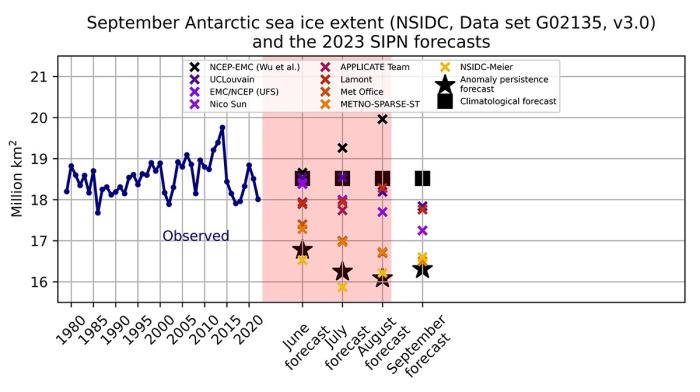
For Antarctica, the forecasts anticipate that this season (2023) will be a record low year. The five SIO submissions predict a negative anomaly relative to the climatological value and are slightly more conservative than the anomaly persistence forecast.
For the Alaskan regional sea-ice extent, a median value of 0.29 million square kilometers was predicted from the nine contributions to the September SIO based on statistical/ML and dynamical methods. The September 2023 SIO forecasts predict Alaska sea-ice extent (Bering, Chukchi, and Beaufort seas) below the 2007–2021 average of 0.40 million square kilometers. The 15 September value for 2023 (0.21 million square kilometers) is below all other years of the SIO record (2008-2022) on this date except the current record low year of 2012 (0.11 million square kilometers).
Five groups submitted supplemental materials to the September report (see: Contributor Full Reports and Supplemental Materials below). The supplemental material contents vary among the contributions, but they may include additional figures and information on methodology including (1) how the forecasts are produced; (2) number of ensemble members used in the forecasts; (3) whether and how bias-corrections are applied; (4) ensemble spread, range of forecasts, uncertainties and other statistics; and (5) whether or not post-processing was performed.
This September Outlook Report was developed by lead author Uma Bhatt, University of Alaska Fairbanks (Executive Summary, Overview of pan-Arctic forecasts, Overview of Alaska regional forecasts, and Discussion of pan-Arctic anomaly sea-ice forecasts), Edward Blanchard-Wrigglesworth, University of Washington (Discussion of predictions from spatial fields and Discussion of current conditions in the Arctic); François Massonnet, Université catholique de Louvain (Discussion of Antarctic contributions); and with input from Walt Meier, National Snow and Ice Data Center, Mitch Bushuk, NOAA's Geophysical Fluid Dynamics Laboratory, Michael Steele, University of Washington, Applied Physics Laboratory; Matthew Fisher and the NSIDC Development Team, (statistics and graphs); Betsy Turner-Bogren and Helen Wiggins, ARCUS (report coordination and editing).
Note: The Sea Ice Outlook provides an open process for those who are interested in Arctic sea ice to share predictions and ideas; the Outlook is not an operational forecast.
See: September Call for Contributions
Pan-Arctic Sea-Ice Forecasts
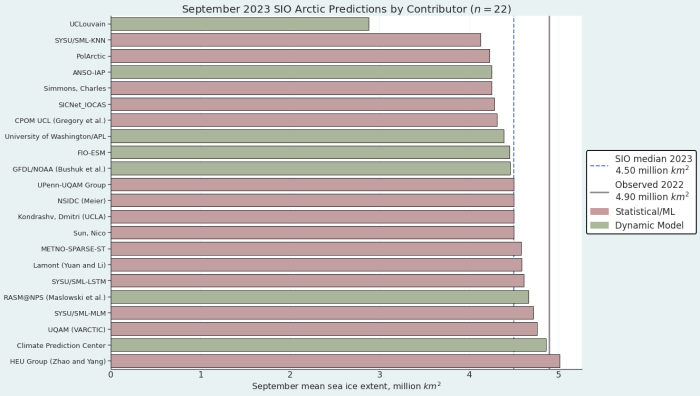
The September 2023 Outlook received 22 pan-Arctic contributions (Figure 1). This year's median forecasted value for pan-Arctic September sea-ice extent is 4.50 million square kilometers with interquartile values of 4.2 and 4.61 million square kilometers. The September 2023 median forecast is slightly lower than the August median forecast (4.6 million square kilometers). September submissions have been collected only since 2021 and the 2023 median forecast lands between 2021 (4.0 million square kilometers) and 2022 (4.91 million square kilometers). The lowest sea-ice extent forecast is 2.88 million square kilometers, from UC Louvain, which was also true for the August 2023 SIO. This would be a new record low for the satellite period (1979-present). The highest sea-ice extent forecast is 5.01 million square kilometers, from the HEU Group, which would be the highest September extent since 2014. The median observed Arctic sea ice extent for 1–16 September 2023 is 4.38 million square kilometers, suggesting that the final observed value will be close to the median forecast. The observed extent values are from the NSIDC Sea Ice Index (Fetterer et al., 2017), based on the NASA Team algorithm sea ice concentration fields distributed by the NASA Snow and Ice Distributed Active Archive Center (DAAC) at NSIDC (DiGirolamo et al., 2022; Meier et al., 2021).
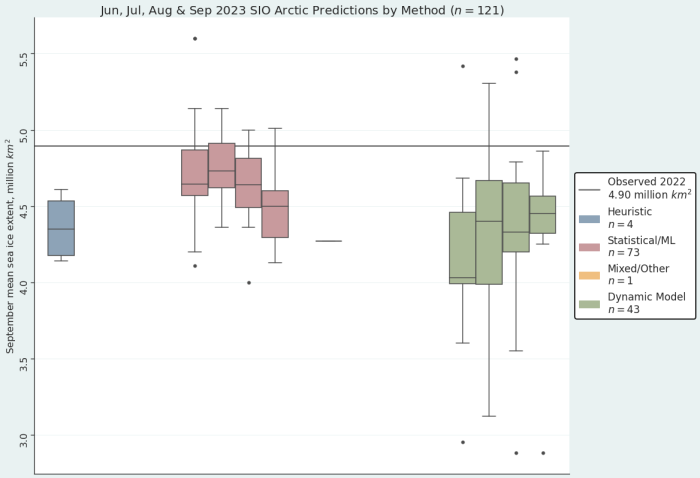
Of the September 2023 contributions, seven are based on dynamical models and 15 are based on statistical/machine learning-based methods. The dynamical models have a median forecast of 4.45 million square kilometers with an interquartile range of 4.32 to 4.56 million square kilometers (Figure 2). Compared to the dynamical models, the statistical models predict similar values for the September 2023 SIO, with a median forecast of 4.5 million square kilometers and an interquartile range of 4.30 to 4.60 million square kilometers. The Outlooks from all methods have medians and interquartile values below last year's observed September extent (4.90), with only a few submissions yielding an extent higher than last year throughout the 2023 SIO season (Figure 2).
Pan-Arctic Sea-Ice Extent Anomalies
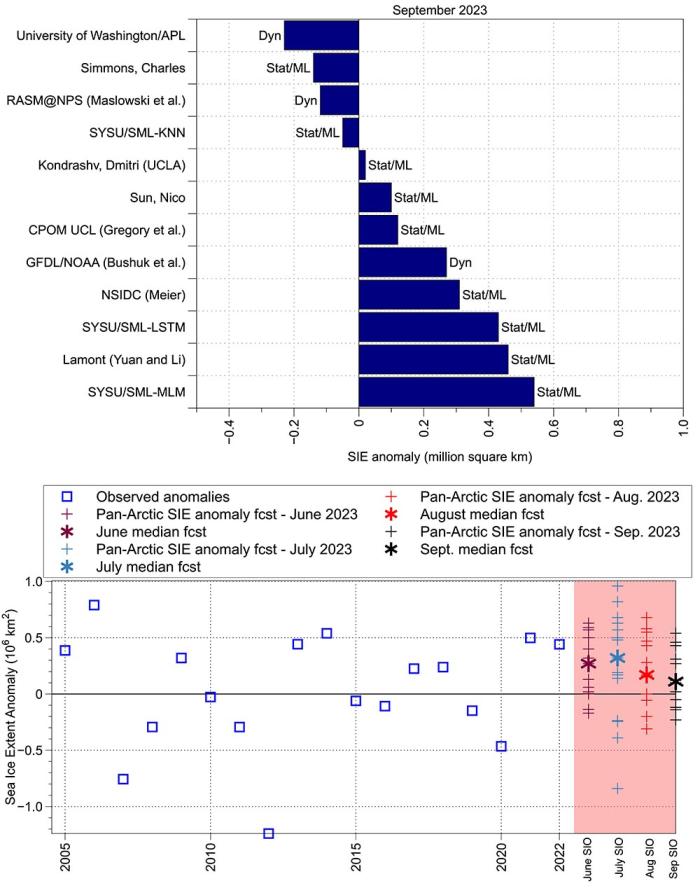
This is the third year that the SIO has solicited forecasts of September mean sea-ice extent anomalies. The pan-Arctic anomaly is the departure of the contributors' September extent Outlook relative to their adopted baseline trend (e.g., the trend in historical observations, model hindcasts, etc.). The 12 anomaly forecasts range from -0.23 to +0.54 million square kilometers, with four at or below and 8 above the contributors' baseline (Figure 3 top). The observed anomalies range from -1.24 (2012) to 0.79 (2006) million square kilometers over 2005–2022 (Figure 3 bottom). The pan-Arctic 2023 August SIO anomaly forecast has a median of +0.11 million square kilometers and interquartile values of -0.07 and 0.34 million square kilometers. The uncertainty in the September SIO anomaly forecasts is reduced from the earlier months. The statistical methods generally predict higher positive anomalies than dynamical methods.
Alaska Regional Forecasts
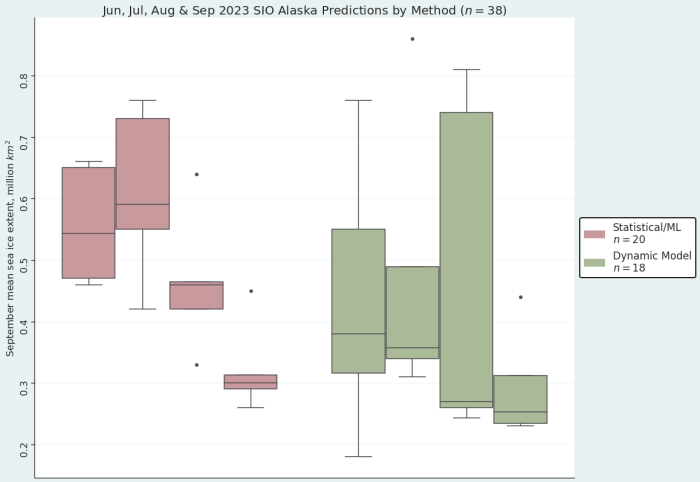
The multimodel median for the September 2023 SIO forecast for the Alaska seas is 0.29 million square kilometers, and ranges from a minimum of 0.23 to a maximum of 0.45 million square kilometers (Figure 4). The dynamical model forecasts range from a minimum of 0.23 to maximum 0.44 million square kilometers with a median of 0.25 million square kilometers. The statistical model forecasts range from a minimum of 0.26 to a maximum of 0.45 million square kilometers with a median of 0.3 million square kilometers. The statistical forecasts display a smaller spread (interquartile range of 0.02) compared to the dynamical models (interquartile range of 0.08) (Figure 5). To place this month's forecast in historical perspective, the September median sea-ice extent for the Alaska seas (Bering, Chukchi, and Beaufort) over 2016–2022 is 0.48 million square kilometers, well below the observed median value over the SIO forecast years for the Alaska sea. The 15 September mean sea ice extent in the Alaska Seas for 2023 is 0.21 million square kilometers, which is the lowest value since 2012 (0.11 million square kilometers), suggesting that 2023 will be one of the lowest September mean SIE in recent years.
Pan-Arctic Forecasts with Spatial Methods
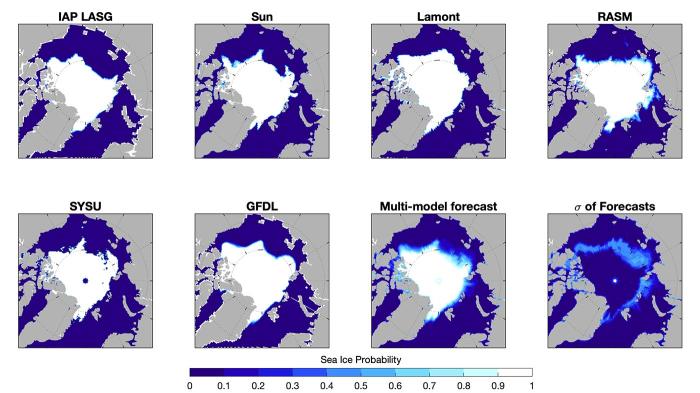
We received six forecasts of September sea-ice probability (SIP) (Figure 6). The forecasts show better agreement, particularly in the Beaufort and the Barents/Kara seas. In the Laptev and East Siberian seas, forecast uncertainty is still significant especially considering the short lead-time.
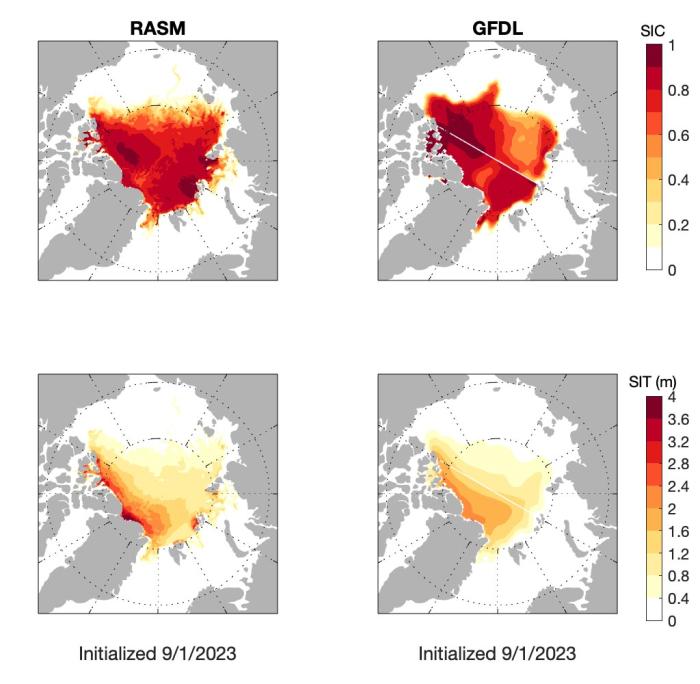
We also received two forecasts of initial conditions from RASM and GFDL. Despite the small sample size, as in the August forecasts we can see how the differences in the initializations may bear on the SIP forecasts: RASM forecasts high SIP values in the Laptev and Kara seas, and initializes its forecasts with high sea-ice concentration (SIC) and sea-ice thickness (SIT) values in this region compared to the GFDL model.
Antarctic Forecasts
We received five forecasts for this September outlook. All five forecasts indicate below-average Antarctic sea-ice extent conditions in September. The five forecasts are more conservative than an anomaly persistence forecast. Continuing on our previous assessment, it is very likely to observe a record-low Antarctic sea-ice extent in September.
Current Conditions
Pan-Arctic Conditions
Information about current conditions can be found at National Snow and Ice Data Center's Arctic Sea Ice News & Analysis. Here we present a brief summary of seasonal 500 hPa anomalies that are relevant for the observed 2023 sea ice conditions.
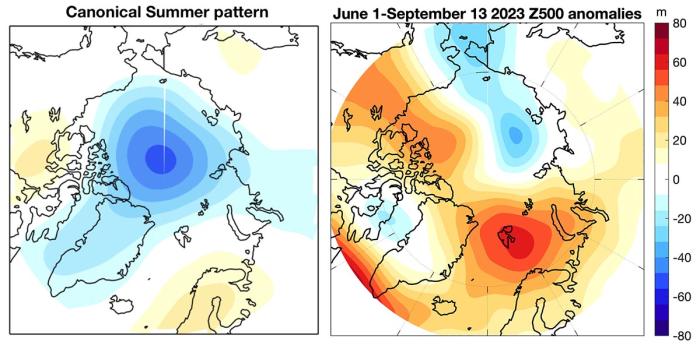
The 500 hPa ('Z500', about 5.5 kilometers up in the atmosphere) geopotential anomalies for 1 June through 13 September 2023 (calculated from the ERA5 reanalysis) show negative anomalies over the Siberian Arctic and positive anomalies over Svalbard and the Canadian Arctic Archipelago (Figure 9). The summer pattern of geopotential height anomalies at 500 hPa that covaries with September sea-ice extent can also help account for forecast uncertainty in SIO forecasts, with summers that have low Z500 anomalies tending to have more sea ice (and forecasts that tend to under-predict SIE) and vice versa (Blanchard-Wrigglesworth et al., 2023). In Figure 9 we show the canonical summer pattern, and the so-far (1 June–31 September) observed pattern of Z500 anomalies for summer 2023.
This summer's pattern resembles more a dipole of high-low Z500 anomalies, and is mostly orthogonal to the canonical pattern. Thus, in terms of pan-Arctic sea-ice extent (SIE) anomalies, the atmospheric circulation pattern has likely not strongly influenced September SIE or the SIO forecast error. We will show updated analysis in the post-season report in the fall.
References
Blanchard‐Wrigglesworth, E., Bushuk, M., Massonnet, F., Hamilton, L.C., Bitz, C.M., Meier, W.N. and Bhatt, U.S., 2023. Forecast skill of the Arctic Sea ice outlook 2008–2022. Geophysical Research Letters, 50(6), p.e2022GL102531.
Contributor Full Report PDFs and Supplemental Materials
This report was developed by Sea Ice Prediction Network (SIPN) team members.
Report Lead:
Uma Bhatt, University of Alaska Fairbanks, Dept. of Atmospheric Sciences, Geophysical Institute, International Arctic Research Center
Additional Contributors:
- Edward Blanchard-Wrigglesworth, University of Washington, Department of Atmospheric Sciences
- Walt Meier, National Snow and Ice Data Center (NSIDC), Cooperative Institute for Research in Environmental Sciences (CIRES) at the University of Colorado, Boulder.
- François Massonnet, Université Catholique de Louvain (Belgium)
- Mitch Bushuk, NOAA Geophysical Fluid Dynamics Laboratory (GFDL)
- Michael Steel, University of Washington, Applied Physics Laboratory
- Matthew Fisher and the NSIDC Development Team, NSIDC, Cooperative Institute for Research in Environmental Sciences at the University of Colorado Boulder
Editors:
Betsy Turner-Bogren, Arctic Research Consortium of the U.S. (ARCUS), Project Manager
Helen Wiggins, (ARCUS), Executive Director
Suggested Citation:
Bhatt, U.S., E. Blanchard-Wrigglesworth, M. Bushuk, M. Fisher, F. Massonnet, W. Meier, M. Steele, and H. V. Wiggins. Editors: Turner-Bogren, B. and H. V. Wiggins. September 2023. "Sea Ice Outlook: 2023 September Report." (Published online at: https://www.arcus.org/sipn/sea-ice-outlook/2023/september)
This Sea Ice Outlook Report is supported in part by with funds from NSF award #1331083. Any opinions, findings, and conclusions or recommendations expressed in this material are those of the author(s) and do not necessarily reflect the views of the National Science Foundation.
