Outlook Report
Executive Summary
We express our thanks to all the groups and individuals who submitted their contribution to the 2020 July Sea Ice Outlook (SIO) report during these difficult times.
We received 38 contributions of predicted September sea-ice extent that included pan-Arctic predictions (compared to 33 contributions for the June report). A total of ten groups included predictions for the Alaska Region (Bering, Chukchi, and Beaufort seas) while seven provided predictions on pan-Antarctic extent. Additionally, we received 13 submissions of sea-ice probability (SIP), and 13 submissions of the first ice-free date (IFD). New this year, we include the September sea-ice concentration contour in the Fram Strait region, motivated by the MOSAiC expedition (8 submissions). Also new this year, we invited contributors to submit their forecast initial conditions (sea-ice concentration and sea-ice thickness) to better understand how observations are being used in forecasts. For the July 2020 SIO, we received four submissions of initial conditions (three from dynamical models and one from a statistical model, the same as for the June report). Echoing conclusions from the June report, the submissions show that models generally agree in their sea-ice concentration initial conditions, but there is a wide spread in their sea-ice thickness initial conditions. We also include a section on supplemental materials (from 12 groups) providing information on methodology behind the predictions and additional graphics.
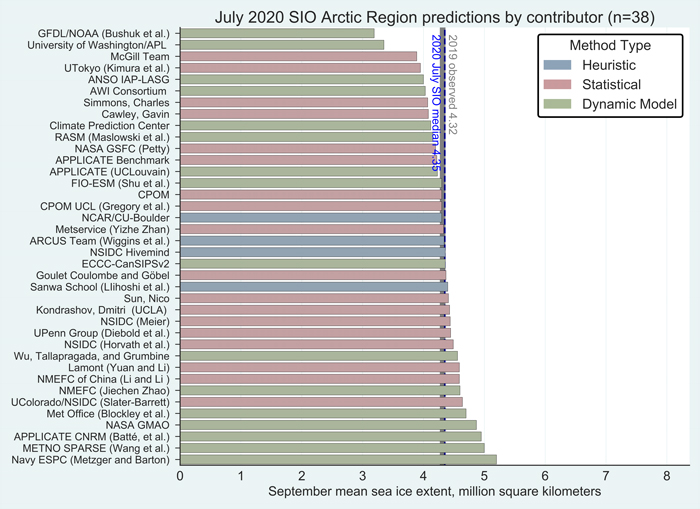
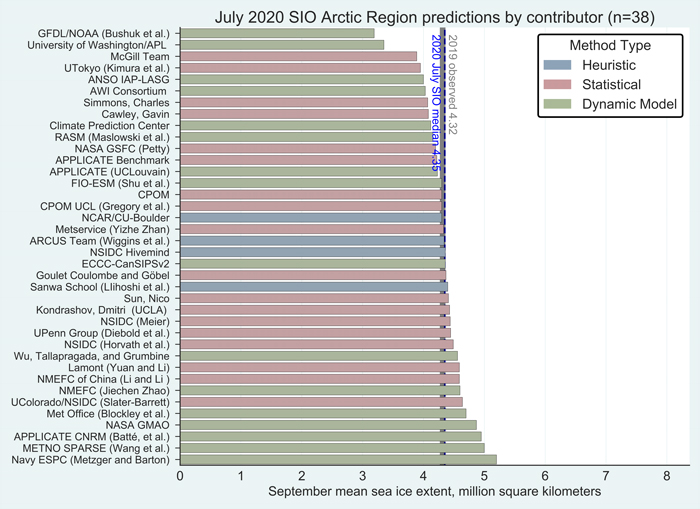
For the Arctic, the median July Outlook for September 2020 average sea-ice extent is 4.36 million square kilometers, essentially identical to the median prediction in the June report, with quartiles of 4.1 and 4.6 million square kilometers. For comparison, the historical record September low over the period of satellite observations was set in 2012 at 3.57 million square kilometers, and the second lowest record was 4.27 million square kilometers set in 2007. This year's projection is close to the 2019 observed September sea-ice extent of 4.32 million square kilometers. As was also the case for the June report, only two of the outlooks project September sea-ice extent below the 2012 record. The consensus judgement against a new record low September sea-ice extent hence remains unchanged. Interestingly, as of this report, observed extent stands at a record low for this time of year.
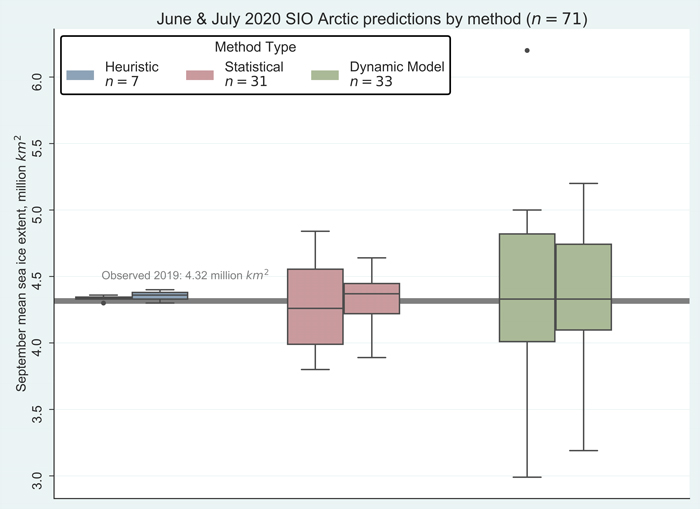
As was also the case for June, there is strong agreement in predicted September sea-ice extent in 2020 among the median values of 4.3, 4.4, and 4.3 million square kilometers from the dynamical, statistical, and heuristic approaches, respectively. As noted in the June report, this is different from what has been seen in the past—heuristic approaches had generally lower median values and the dynamical models had generally higher September sea-ice extent values compared to the overall median. Not surprisingly, however, for each method, the spread in predictions is smaller in comparison to the June predictions of September extent. In terms of sea-ice probability, there is general agreement between models of an open Northern Sea Route in September; satellite data indicate that as of this report, the Northern Sea Route is already open.
For the Alaska region, (the combined Bering, Chukchi, and Beaufort seas), six predictions of September extent are based on dynamical models and four are based on statistical methods. Forecasts range from 0.08 million square kilometers to 0.98 million square kilometers, which are below the median observed value of mean September sea ice extent in the Alaska region over the 1981–2010 period of 1.04 million square kilometers.
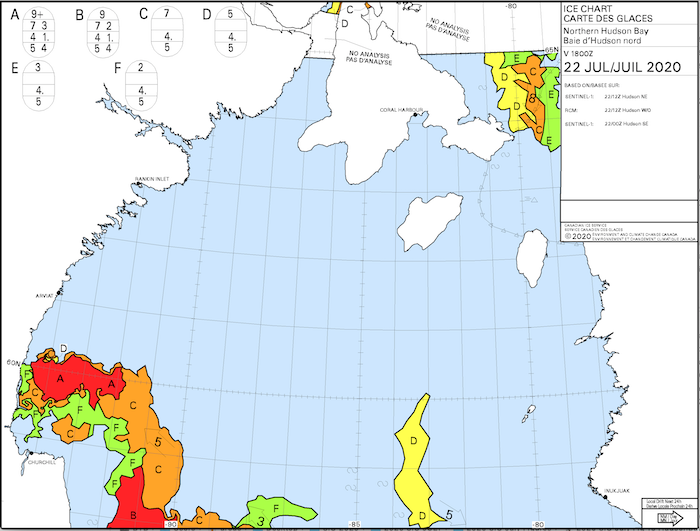
For Hudson Bay, the 2020 SIO June report contained ice-free date (IFD) forecasts. However, as most ice in Hudson Bay is gone by late July, a new set of IFD forecasts was deemed unnecessary. As for recent conditions, as of 22 July, total ice extent in Hudson Bay stood at 190,764 square kilometers, well below the long-term average of 398,540 square kilometers, but above the record low of 139,913 square kilometers observed in 2006. Remaining ice as of 22 July was located offshore of Churchill.
For Fram Strait, motivated by the MOSAiC expedition aboard the German icebreaker research vessel Polarstern, we invited contributions of the 80% September sea-ice concentration contour in the Fram Strait region. Of the eight forecasts, most agree on the location of the 80% contour that is (coincidentally) close to the mid July location of the Polarstern, yet disagree on the southward extension of the 80% contour into the East Greenland Sea.
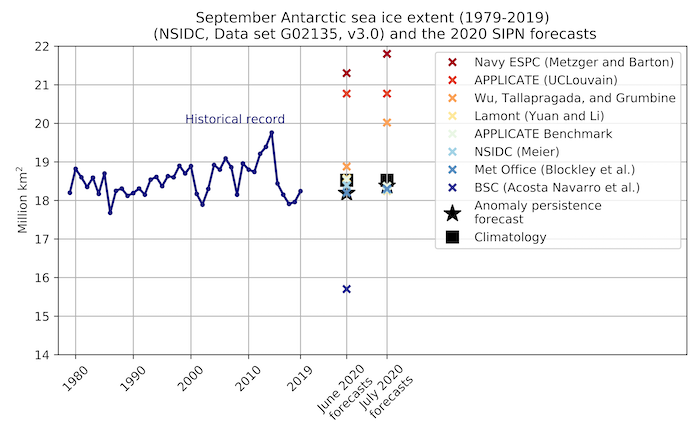
For the Antarctic, sea ice reaches its maximum extent in September. For this July report, there were seven forecasts of total September Antarctic sea-ice extent (including a re-submission from the June report). One June submission (BSC) was not resubmitted, and was the model that predicted the lowest extent in the June report. There is a very large spread in the July forecasts, and the spread is only reduced in comparison to the June report because of elimination of this outlier model.
This July Outlook report was developed by lead authors Mark Serreze, University of Colorado (Executive Summary, Overview, and discussion of current conditions) and James Overland, NOAA Pacific Marine Environmental Laboratory (PMEL; Overview and discussion of current conditions); with contributions from Edward Blanchard-Wrigglesworth, University of Washington (discussion on predicted spatial fields and Fram Strait); Cecilia Bitz, University of Washington (spatial field figures); Michael Steele, University of Washington (discussion of ocean heat); Uma Bhatt, John Walsh, and Richard Thoman, University of Alaska Fairbanks (discussion of ice conditions in the Bering and Chukchi seas); Julienne Stroeve, National Snow and Ice Data Center (NSIDC; discussion of ice conditions in the Hudson Bay region); François Massonnet, Université Catholique de Louvain (discussion of Antarctic contributions); Joseph Little (discussion of User Needs); Molly Hardman, NSIDC (statistics and graphs); Betsy Turner-Bogren, Helen Wiggins, Stacey Stoudt, and Lisa Sheffield Guy, ARCUS (report coordination and editing); and the rest of the SIPN2 Project Team.
Note: The Sea Ice Outlook provides an open process for those who are interested in Arctic sea ice, to share predictions and ideas; the Outlook is not an operational forecast.
See: July Call for Contributions
Overview
The 38 Arctic June Outlook contributions for September 2020 sea-ice extent projections are based on multiple approaches (Figure 1). There were four contributions using a heuristic (qualitative) analysis approach, 18 using statistical methods, and 16 using dynamical models (based on physics equations). This year's median projected value from the July forecasts of 4.3 million square kilometers is essentially identical to the median from the June forecasts. Quartiles are 4.1 and 4.6 million square kilometers. As was also the case for June, only two projections, both by dynamic models, are for a new record low, below the mark of 3.57 million square kilometers set in 2012. One dynamical model predicts the September sea-ice extent above 5.0 million square kilometers, compared to two in the June report.
Except for the highest and the two lowest contributions, all estimates are in a narrow range, and the range is smaller than for the June predictions of September ice extent. Having said this, projections from dynamic models have the largest spread of contributed outlooks, as was the case in June, from a low of 3.4 million square kilometers to a high of 5.2 million square kilometers. The spread between the projections from the four heuristic approaches is particularly small, and all of these are very close to the 38-model median of 4.3 million square kilometers. The median values from the three methods are in turn close to each other at 4.3 (dynamic approaches), 4.4 (statistical approaches), and 4.3 (heuristic) million square kilometers (Figure 2).
Overall, the situation is little changed from the June report. There is a collective view that September ice extent will be reasonably close to the observed linear trend line, implying there will be no rapid decreases in Arctic sea-ice extent through the rest of the summer leading to a new record low. The extreme September minima in 2007 and 2012 appear to be singular events forced by high temperatures and an unusual pattern of winds. However, as of this report, sea ice extent is at a record low for late July, largely driven by extensive open water on the Russian side of the Arctic (see Discussion of Current Conditions). Most projections are for an open Northern Sea Route in September, and satellite data show that as of this report, the Northern Sea Route is already open. September extent for the Arctic as a whole, as well as regionally, will strongly depend on weather conditions through the remainder of summer.
Discussion of Spatial Field Predictions
As in recent years, we have invited outlooks for September sea-ice probability (SIP) and first ice-free date (IFD). Additionally, SIPN2 is now computing SIP and IFD from forecasts of sea-ice concentration (SIC) submitted directly by contributors, and we encourage all groups to submit full-field SIC forecasts whenever possible. We do not bias-correct any fields.
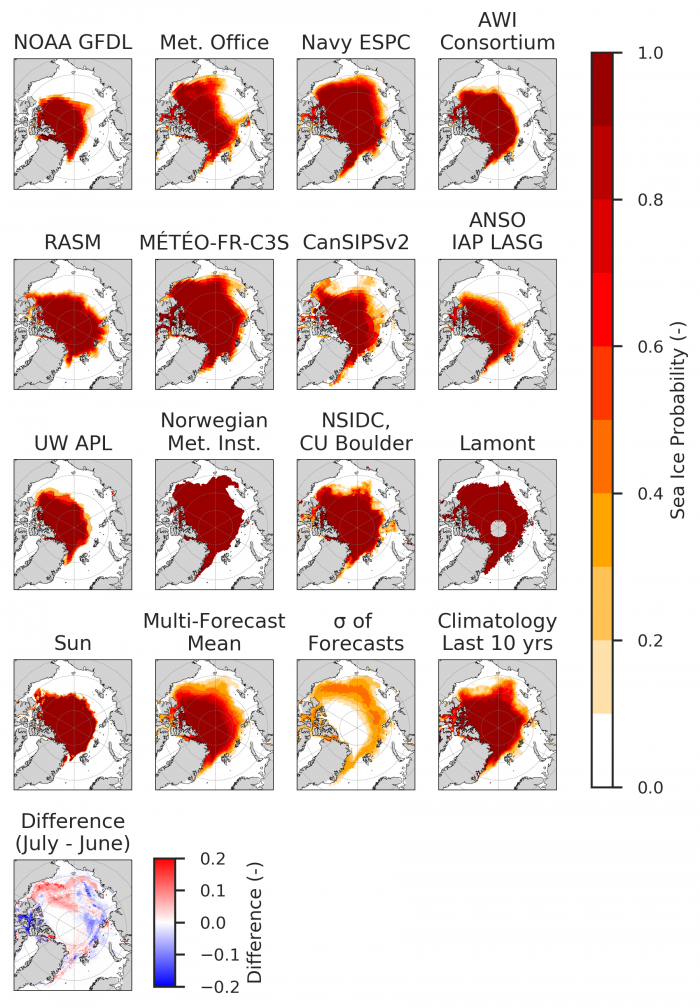
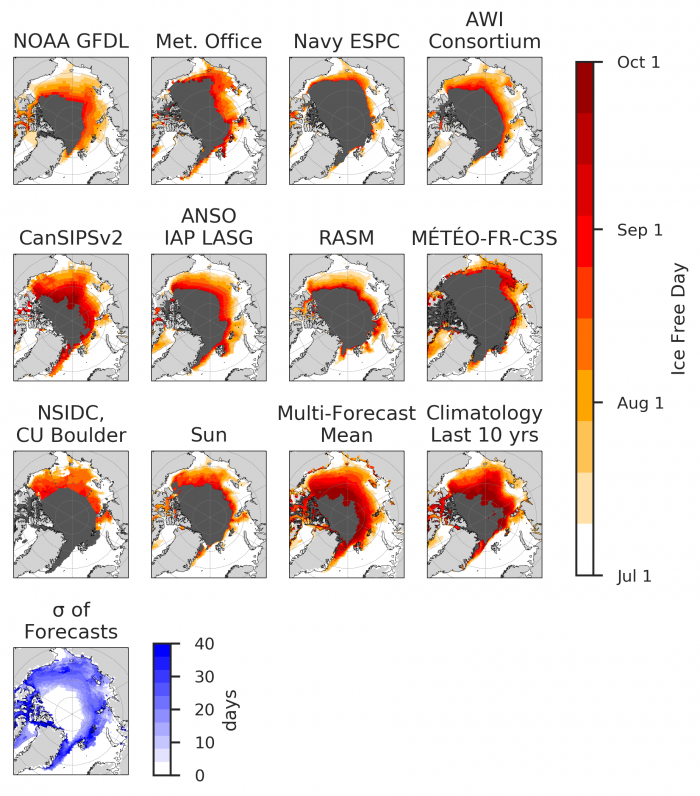
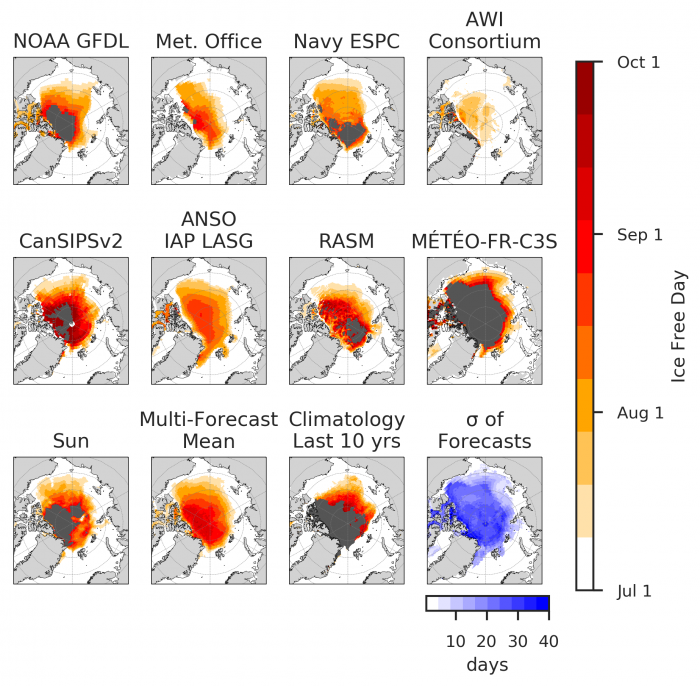
SIP is defined as the fraction of ensemble forecasts that forecast September ice concentration in excess of 15% (for example, if just four out of eight ensemble forecasts predict in excess of 15% sea ice, the SIP is 50%). IFD is the first date in the melt season at which the ice concentration at a given location first drops below a certain threshold—this year we provide forecasts of IFDs for two thresholds, 15% and 80% sea-ice concentration. There are 13 forecasts of SIP (10 dynamical, 3 statistical) and 10 forecasts of IFD (8 dynamical, 2 statistical).
Editor's note: Figures 3, 4, and 5 are updated as of 29 July 2020.
Sea Ice Probability (SIP)
Forecasts of SIP (Figure 3) show generally low sea-ice probabilities along the Laptev and East Siberian seas (with high confidence of an open Northern Sea Route), however, as in the June SIO, model forecast uncertainty is significant—for example note the difference between low SIP forecasts from NOAA GFDL, UW APL, RASM, and IAP LASG and higher SIP forecasts from the UK MetOffice and Navy ESPC. Comparison with the June SIO SIP forecasts show consistency in the models that forecast high or low SIP between June and July SIOs. As has been the case in past years, models agree better in the Svalbard/Barents/Kara regions. Comparing the model-mean SIP forecasts between June and July SIOs shows a slight tendency for higher SIP in the Beaufort/Chukchi/East Siberian seas, and lower SIP in the Barents/Kara/Laptev seas. As already noted, satellite data indicate that as of this report, the Northern Sea Route is already open. Few models point to an open Northwest Passage (the southern, or Amundsen's Route).
First Ice-Free Date (IFD)
Figures 4 and 5 show the IFD metrics from forecasts and climatology using two SIC thresholds, 15% and 80%. With either threshold, there is significant model uncertainty in timing of IFD. Interestingly, the regions of high forecast uncertainty in 15% IFD and 80% IFD are not co-located.
(Editor's note: Figures 4 and 5 updated on 4 August 2020.)
Forecast Initial Conditions
This year, we invited contributors to submit their forecast initial conditions (ICs, for sea-ice concentration and sea-ice thickness) to better understand how observations are being used in forecasts and investigate the relationship between initial conditions and forecasts. For the July 2020 SIO, we received five submissions of ICs from dynamical models (RASM, Navy ESPC, NOAA GFDL, AWI, and CanSIPSv2), shown in Figure 6. CanSIPSv2 is a two-model forecast system, and we show the ICs used by both individual models.
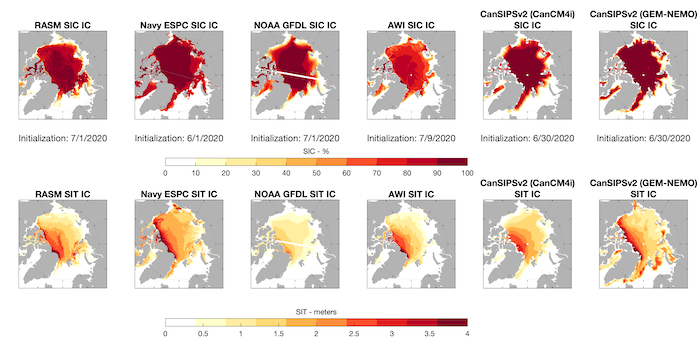
Figure 6 shows that models agree reasonably well in their sea-ice concentration initial conditions but there is wider spread in their sea-ice thickness initial conditions, even for models initialized around the same date (e.g., compare NOAA GFDL, RASM, and CanSIPSv2). There is a tendency in the models with thinner SIT to forecast lower SIPs in Figure 3 above (e.g., NOAA GFDL, AWI), while Navy ESPC uses thicker SIT initial conditions and forecasts higher SIP and September extent (see Figure 3 and Figure 1).
Discussion of Supplemental Materials and Methods
For the July 2020 SIO, 12 groups submitted supplemental materials (see: Contributor Full Reports and Supplemental Materials below). This material has not been typically discussed in the outlooks and we include this brief section to describe the type of information that is available. Around half of the supplemental documents contain methodology information while the other half include additional graphics that convey a variety of information: ensemble spread, hindcasts, spatial forecast information, and distributions. We intend to invite the community to provide input on how this information can be best conveyed, likely via a survey.
Discussion of Current Conditions
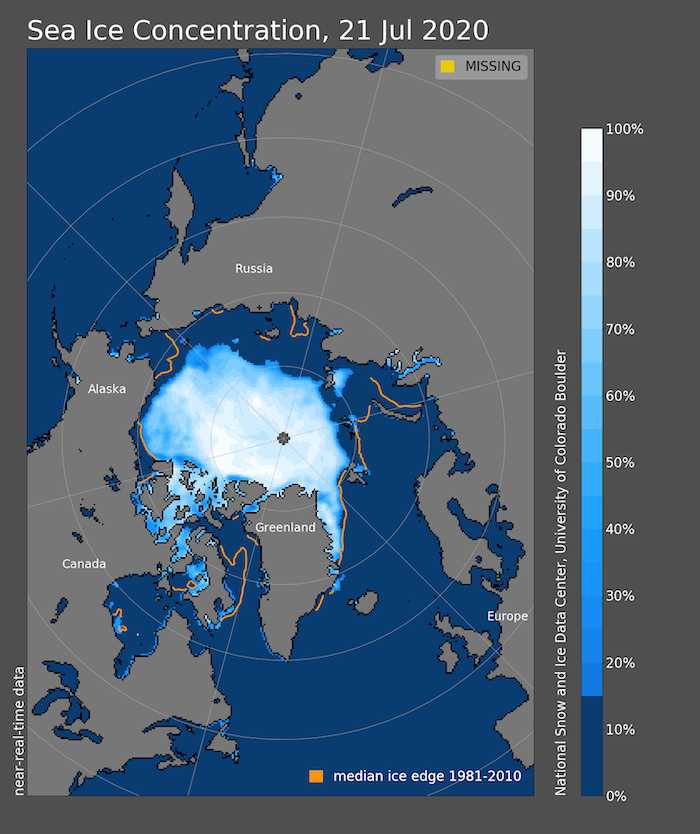
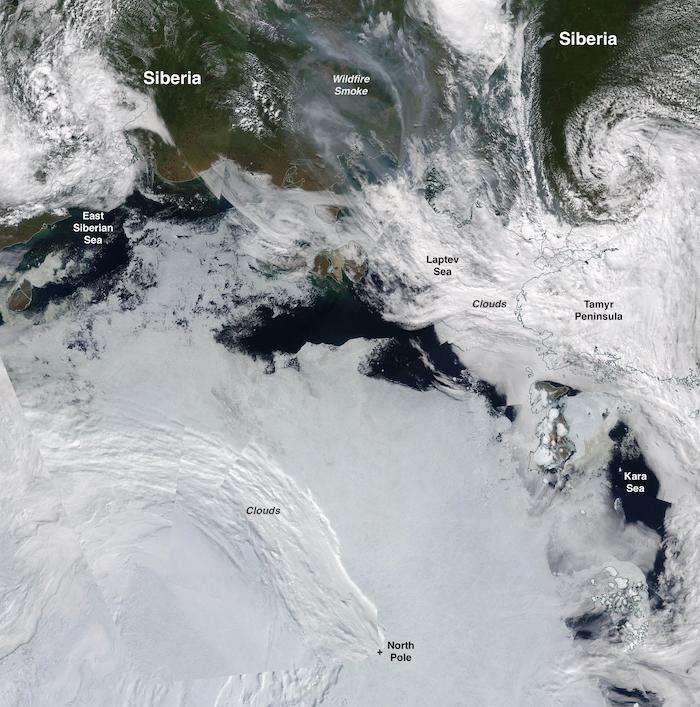
The view from the forecasts is against a new record low for September. However, as of 21 July, observed Arctic sea-ice extent stood at 6.71 million square kilometers, the lowest level for this time of year on the satellite record. From the middle of June to the time of this report, the daily rate of decline in extent for the Arctic as a whole has been particularly fast (Figure 7). Low extent for the Arctic as a whole is largely driven by extensive open water on the Russian side of the Arctic (Figure 8), continuing the pattern that began this spring. Ice concentrations are low in the East Siberian Sea (Figure 9); remaining ice in this area is likely to melt out soon. Extent is also far below average in Baffin Bay. By contrast, extent north of Alaska is closer to the 1981 to 2010 average for this time of year. Such contrasts serve as prominent examples of the larger variations that occur for sea ice extent on the regional scale in comparison to the Arctic Ocean as a whole. Based on AMSR2 imagery processed by the University of Bremen, the Northern Sea Route along the Russian coast is already open. The southern route of the Northwest Passage (Amundsen's route), remains choked by ice.
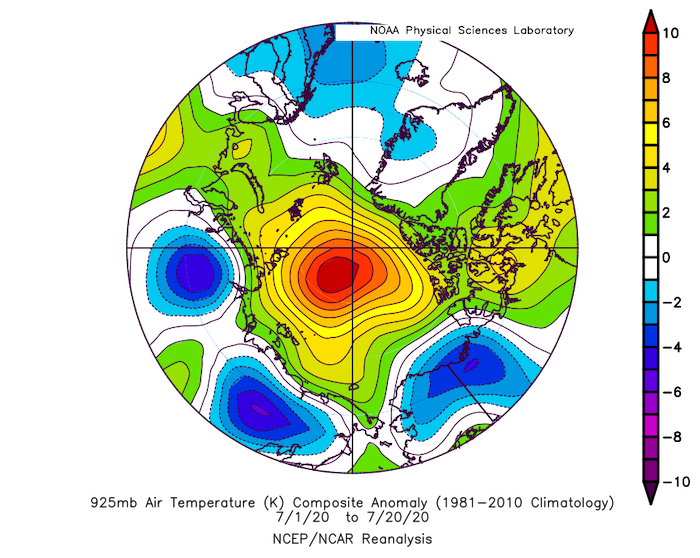
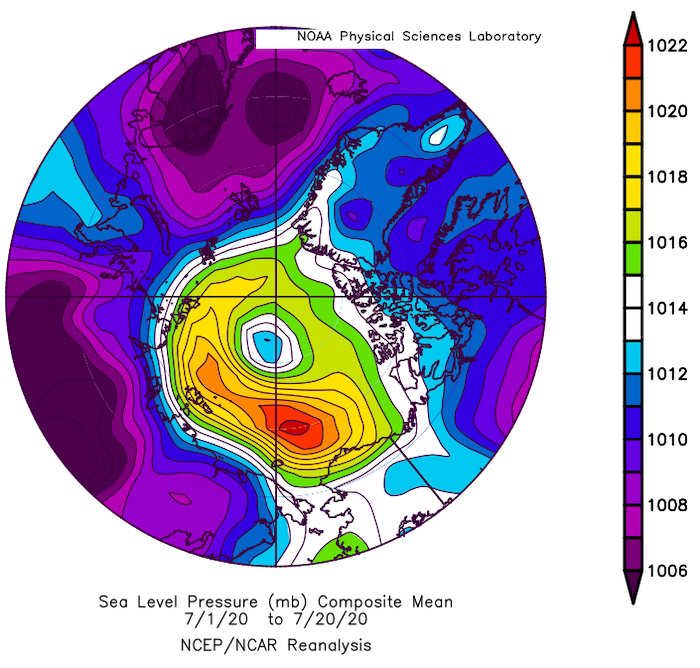
Air temperatures at the 925 mb level (about 2,500 feet above sea level), as averaged over from 1–20 July, are unusually high over the central Arctic Ocean—up to 10 degrees Celsius, with smaller positive anomalies along the Russian coast (Figure 10). These above average temperatures are associated with high sea level pressure, centered over the East Siberian and Chukchi seas (Figure 11).
An anticyclonic SLP pattern is generally viewed as favoring large summer ice losses. The July temperature pattern seen so far is in sharp contrast to June, when, as part of the "Siberian Heat Wave" that garnered much attention in the media, temperatures along the Siberian coast of the eastern Laptev Sea were 8 degrees Celsius above average. It is likely these high temperatures, combined with ice motion away from the coast, initiated early ice retreat along the Russian coast, leading to the present low ice extent. This last winter was characterized by a strong and persistent positive phase of the Arctic Oscillation, which from past studies, favors thinner spring ice along the Siberian shores; this may also play a role in the low ice extent now being observed. It has been speculated that the early loss of ice along the Russian coast may also be related to deposition of soot from wildfires associated with the Siberian heat wave, but this remains to be investigated.
While, as of this report, extent is at a record low for this time of year, extent this coming September will depend critically on weather patterns through the remainder of this summer. A transition to a more cyclonic type of pattern will tend to favor lower air temperatures and inhibit surface melt.

Discussion of Ocean Heat
Sea surface temperatures (SSTs) are generally high in the eastern Beaufort Sea, cool along the Alaskan Beaufort coast, and high in the Chukchi, in keeping with the usual pattern (e.g., Steele et al., 2015). The outer shelf of the Laptev Sea is also warm, especially in the west near the Taymyr Peninsula where ice retreat started earliest in this area. Cooler conditions prevail near the Lena River delta, where landfast ice is slow to melt out in most years. North of the Barents Sea, sea ice retreated north of 80 degrees latitude just over the past two weeks, which explains the large areas of still-cool SSTs. Will they warm up much in the coming weeks? Solar energy is declining but ocean currents are warm and capable of bringing significant heat to this area, as seen in the "scalloped" pattern of high/low/high SSTs that extend zonally along ~80N in this area. Finally, Baffin Bay is quite warm, with sea ice having melted out relatively early.
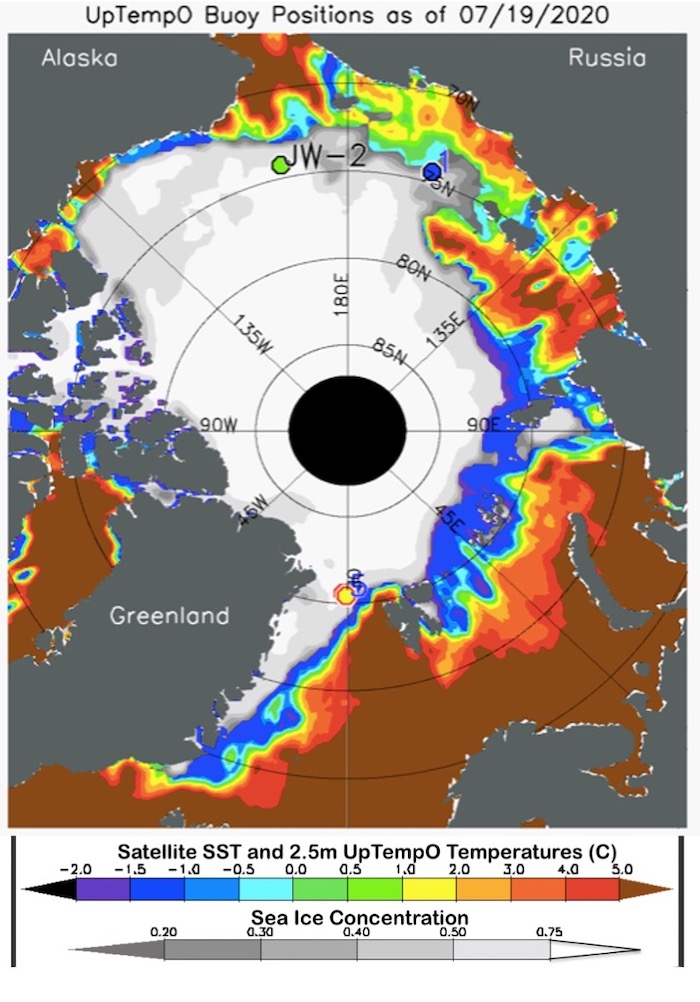
Note: Figure 12 is sourced from NOAA dOISST and NSIDC NRT passive microwave. Data for UpTempO drifting buoys locations is available for downloading from the UpTempO buoy web site.
Regional Sea-ice Extent Discussions
Alaska Region
Sea-ice extent in the combined Chukchi and Beaufort sea region (Figure 13) continues to be slightly lower than the 1981–2010 average (Figure 14). The 19 July 2020 sea ice extent in the Chukchi Sea was 0.43 million square kilometers, which is lower than the 1981–2010 median of 0.57 million square kilometers. The 19 July sea-ice extent in the Beaufort Sea was 0.83 million square kilometers and matches the 1981–2010 median value. The rate of retreat has not increased much since the June SIO, contrary to what might be expected from anomalously high ocean temperatures in June (Figure 15b in the June 2020 SIO). Dynamical forcing may have been more important over the last month. Average 925 hPa winds were from the northeast on the north slope of Alaska in the Beaufort Sea, which helps to maintain sea ice in the area. The analysis of ice age produced by NSIDC shows that mainly multi-year ice was present in the Beaufort Sea in early June, which will also slow summer retreat.
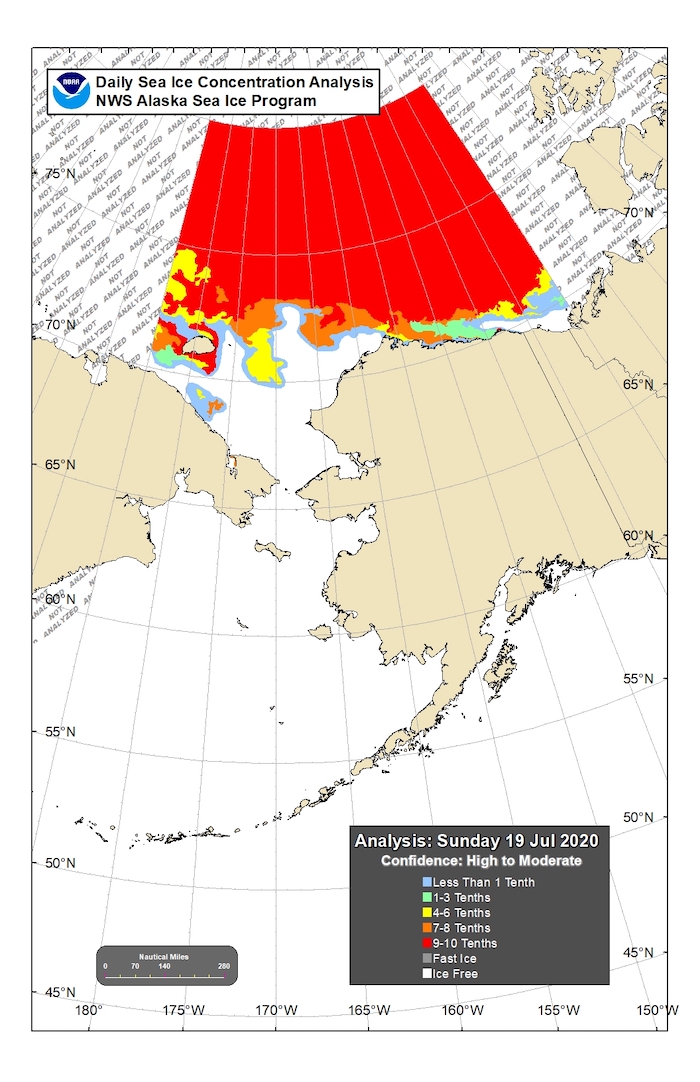
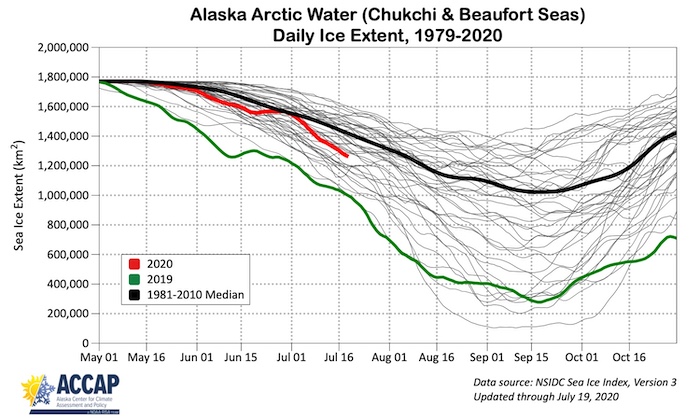
The atmospheric conditions over the next month will bear on the September sea-ice minima. The NOAA CFSv2 and CanSIPS forecasts of August and September near surface air temperature and sea level pressure were examined (https://www.tropicaltidbits.com/). Both models forecast benign pressure patterns over the Arctic Ocean, including the Beaufort/Chukchi seas, for August. The CFSv2 and CanSIPS SLP forecast weak negative pressure anomalies over the Arctic Ocean in September and no strong pressure gradients. The temperature forecasts for both months generally show weak anomalies over the central Arctic, but large positive anomalies equatorward of the ice edge—consistent with an abnormal poleward displacement of the ice edge. Neither model points to strong storminess in August. The stormiest period in the CFS scenario is the remainder of July (the first week of the ensemble of forecasts made July 20). The largest negative SLP anomalies in late July are forecast by the CFS to be just northeast of the Beaufort Sea, which would argue against a rapid expansion of the open water area in this area. If the seasonal forecast verifies then sea-ice retreat will likely not be an extreme in the Beaufort Sea.
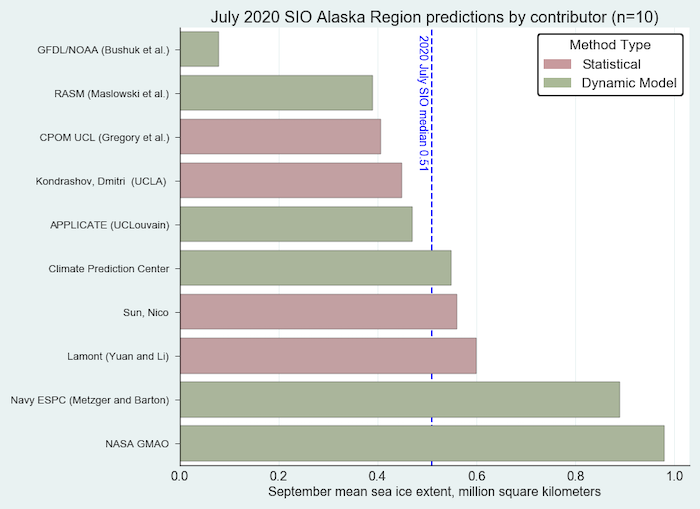
For the Alaskan regional sea-ice extent prediction, four of the ten contributions are based on statistical methods, and six are based on dynamical models (Figure 15). Forecasts range from 0.08 million square kilometers to 0.98 million square kilometers, which are below the median observed values of mean September sea-ice extent in the Alaska Seas over the 1981–2010 period of 1.04 million square kilometers.
Hudson Bay
As of 22 July, total ice extent in Hudson Bay stood at 190,764 square kilometers. This is below the 1981–2010 long-term average of 398,540 square kilometers, but above the record low of 139,913 square kilometers observed in 2006. While sea-ice concentration data from satellite passive microwave shows some sea ice remaining along the eastern coast of Hudson Bay, this is not evident in ice chart data and is thus likely a result of land contamination. Where sea ice remains is offshore of Churchill, shown both in the passive microwave data as well as the Canadian ice chart data (Figure 16).
Fram Strait
This year, motivated by the MOSAiC expedition aboard the German icebreaker, Polarstern, we are providing outlooks of the 80% September sea-ice concentration contour in the Fram Strait region. This value represents closed pack sea ice. Figure 17 shows forecasts from eight different models, together with the current (15 July 2020) and June (18 June 2020) locations of the Polarstern/MOSAiC.
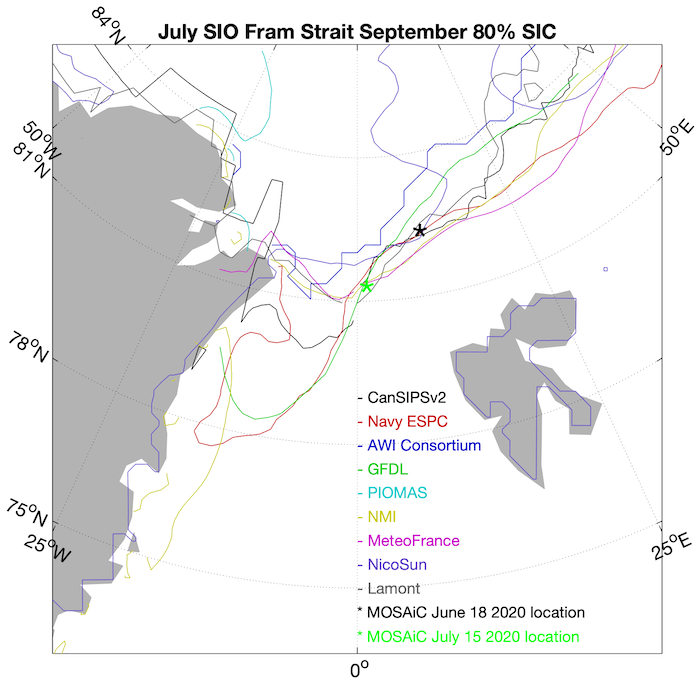
Most forecasts agree that the 80% contour in September will remain close to the mid-July location of the MOSAiC ship, yet models disagree on the southward extension of the 80% contour into the East Greenland Sea. Since June, the MOSAiC location has generally drifted southeast. A southeast drift tends to favor higher sea-ice extent later in the summer.
Antarctic Contributions
For this July report, we received seven forecasts of total September Antarctic sea-ice extent (one is a re-submission from the June report). One June submission (BSC) was not resubmitted, and was the one projecting the lowest September extent. There is a very large spread in the forecasts (Figure 18), and the spread is only reduced from June to July by elimination of this outlier forecast.
Discussion of User Needs
Engagement with participants in the Bering Sea fixed gear fishery, which consists of both crab and cod fishing operations, was accomplished via survey through the spring and early summer of 2020. Crabbing operations typically run through the winter and early spring. Members of the fishery hence must anticipate and be prepared for encountering sea ice.
The principal objective of the survey was to identify interest in, and preferences for, a seasonal sea-ice forecast for the region. The survey was administered using an online platform and asked questions that addressed experience in the fishery, utilization of synoptic sea-ice forecasts, interest in having a sea-ice forecast one month in advance of operations, and the geographic areas and months in which a forecast could be used. Approximately 14 ship captains shared their insights.
As identified by respondents, the primary negative impacts on fishing operations resulting from sea ice, included lost gear, lost days fishing, and vessel damage. There was interest in having a one-month sea-ice forecast, in particular. As identified by survey respondents, the availability of a one-month forecast would be most beneficial to operational safety. With respect to what information to convey in the forecast and which month such forecasts would be most useful, respondents noted that information on the location of sea ice was most important and that they would most benefit from forecasts in the month of January. While the survey sample is relatively small, the information provided by ship captains provides some of the first insights into whether longer run sea-ice forecasts can be utilized by an economically valuable industry. Clearly, additional work is needed to expand the engagement efforts, but as a start this initial information points researchers in a useful direction.
References
Steele, M., Dickinson, S., Zhang, J., and Lindsay, R. 2015. Seasonal ice loss in the Beaufort Sea: Toward synchrony and prediction. J. Geophys. Res. Oceans 120: 1118–1132, doi:10.1002/2014JC010247.
Contributor Key Statements, Summary of Uncertainties
![]() Summary Table of Key Statements from Individual Outlooks (PDF 207 KB)
Summary Table of Key Statements from Individual Outlooks (PDF 207 KB)
Contributor Full Report PDFs and Supplemental Material
This report was developed by the SIPN2 Leadership Team
Report Lead:
Mark Serreze, National Snow and Ice Data Center (NSIDC) Director, University of Colorado Boulder, NSIDC
Additional Contributors:
Richard Thoman, Alaska Center for Climate Assessment and Policy, International Arctic Research Center, University of Alaska
Molly Hardman, Cooperative Institute for Research in Environmental Sciences at the University of Colorado Boulder, NSIDC
Editors:
Betsy Turner-Bogren, ARCUS
Helen Wiggins, ARCUS
Stacey Stoudt, ARCUS
Lisa Sheffield Guy, ARCUS
Suggested Citation
Serreze, M., U.S. Bhatt, P. Bieniek, E. Blanchard-Wrigglesworth, H. Eicken, M. Hardman, L. C. Hamilton, J. Little, F. Massonnet, W. Meier, J.E. Overland, M. Steele, J. Stroeve, R. Thoman, J. Walsh, M. Wang, and H. V. Wiggins. Editors: Turner-Bogren, B., L. Sheffield Guy, S. Stoudt, and H. V. Wiggins. July 2020. "Sea Ice Outlook: 2020 July Report." (Published online at: https://www.arcus.org/sipn/sea-ice-outlook/2020/july.)
This Sea Ice Outlook Report is a product of the Sea Ice Prediction Network–Phase 2 (SIPN2), which is supported in part by the National Science Foundation under Grant No. OPP-1748308. Any opinions, findings, and conclusions or recommendations expressed in this material are those of the author(s) and do not necessarily reflect the views of the National Science Foundation.
