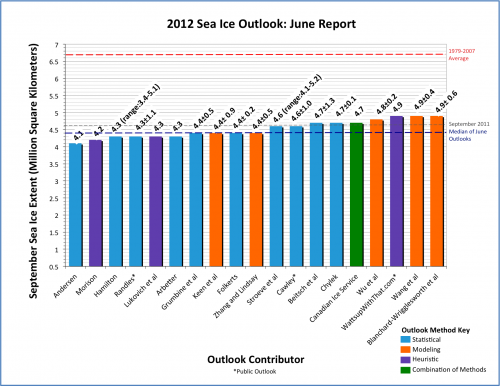
With 19 responses for the Pan-Arctic Outlook (plus 6 regional Outlook contributions), the June Sea Ice Outlook projects a September 2012 arctic sea extent median value of 4.4 million square kilometers, with quartiles of 4.3 and 4.7 million square kilometers (Figure 1). This compares to observed September values of 4.6 in 2011, 4.9 in 2010, and 5.4 in 2009. Both the 2012 quartile values and the range (4.1 to 4.9) are quite narrow. The 2012 June Outlook differs from all previous Outlooks in that there are no projections of extent greater than 5.0. It is always important to note for context that all 2012 estimates are well below the 1979–2007 September mean of 6.7 million square kilometers.
Individual responses are based on a range of methods: statistical, numerical models, comparison with previous rates of sea ice loss, composites of several approaches, estimates based on various non-sea ice datasets and trends, and subjective information. The consensus is for a continued downward trend of September sea ice. It seems that the time may have come to declare that the arctic sea ice has in fact reached a "New Normal." The physical justification for this statement is based primarily on the loss of old, thick sea ice and the increased mobility of sea ice. An expanded discussion of sea ice age and thickness is included in this month's full report, which includes new sea ice thickness data from NASA "IceBridge" aircraft flights in March–April 2012.
Credit for Sea Ice Outlook Report: Arctic Research Consortium of the US (ARCUS)
Pan-Arctic Full Outlook
OVERVIEW OF RESULTS
With 19 responses, the same as last year (thank you!), the June Sea Ice Outlook (based on May data) projects a September 2012 arctic sea extent median value of 4.4 million square kilometers, with quartiles of 4.3 and 4.7 million square kilometers (Figure 1). This compares to observed September values of 4.7 in 2008, 5.4 in 2009, 4.9 in 2010, and 4.6 in 2011. The median for 2012 is below the June Outlook estimates from 2011 of 4.7. The 2012 quartile values and the range of 4.1 to 4.9 are both quite narrow. The 2012 June Outlook differs from previous Outlooks in that there are no projections of extent greater than 5.0. It is always important to note for context that all 2012 estimates are well below the 1979–2007 September mean of 6.7 million square kilometers.
Individual responses continue to be based on a range of methods: statistical, numerical models, comparison with previous rates of sea ice loss, composites of several approaches, estimates based on various non sea ice datasets and trends, and subjective information (the heuristic category). The range of all Outlook values is similar to those expressed by individual uncertainty estimates. The consensus is for a continued downward trend of September sea ice.
Outlooks are not firm forecasts; their purpose is to promote a discussion of the physics and factors influencing summer sea ice loss. Again in 2012, we are pleased at the extent of methods and discussions and thank the contributors for their considerable efforts. The total effort of the Outlook is greater than the individual parts.

DISCUSSION
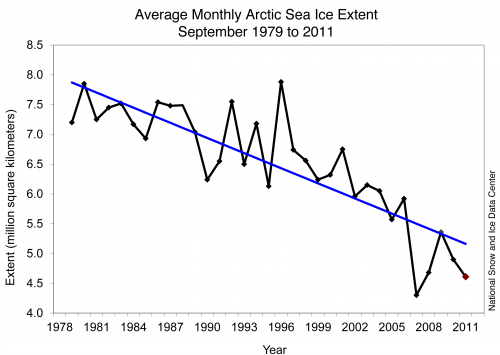
The Sea Ice Outlook (SIO) is well established; participation remains high, with contributions based on methodologies ranging from numerical models to informed estimates. This was our main goal for the Outlook: to create a forum for an informed community discussion of arctic sea ice loss and variability. With regard to the Outlook estimates for the past two years, the median values for June outlooks for sea ice extent were within 0.1 million square kilometers (msk) of the observed values of 4.9 msk in 2010 and 4.6 msk in 2011. The quartile range of values is generally under ±0.5 msk. We would argue that the good fit is due to the shift of sea ice away from the long term 1979-2007 mean of 6.7 msk (Figure 2). Every year starting in 2007 has had a lower extent value than for the minimum extent years before 2007. It seems that the time has come to declare that the Arctic has in fact reached a "New Normal." The physical justification for this statement is based primarily on the loss of old, thick sea ice and the increased mobility of sea ice (less extensive, thinner ice is more mobile).
Sea Ice Age and Thickness
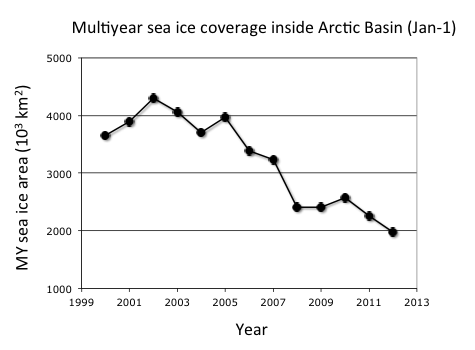
Time series of multiyear sea ice show a 50% loss between 2005 and 2012, as provided by Ron Kwok (Figure 3). This estimate includes 2nd- and 3rd-year sea ice and covers only the central Arctic Basin, so the loss of older thicker sea ice is even greater (see also Comiso, 2011, J. Climate, Vol. 25, p1176-1193).
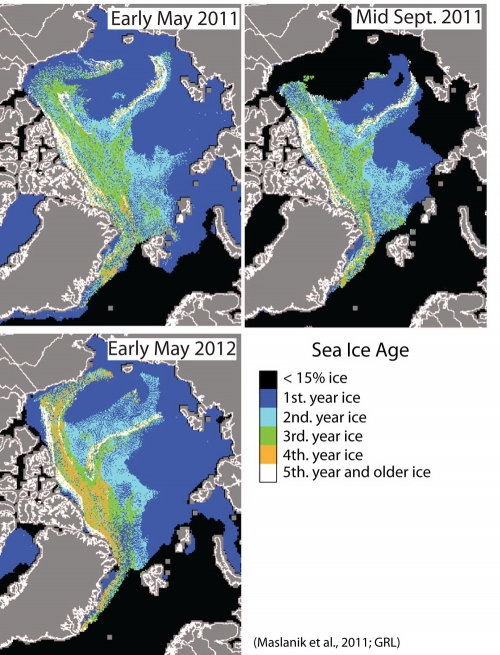
The Kwok figure is reinforced by Figure 4 by Jim Maslanik and Mark Tschudi, which maps the distribution of different sea-ice age classes. These ice-age maps are based on tracking the motion of sea ice using passive-microwave satellite data. Please keep in mind that these maps outline areas where at least some multiyear ice is expected rather than areas where multiyear ice is prevalent. Regarding conditions for spring 2012, Figure 4 shows maps of ice categories derived from sea-ice age for the beginning of May 2012, with maps for early May and mid-September 2011 included for comparison. Blue regions are areas of first-year sea ice. Maslanik makes the following observations about this year's conditions: The presence of a tongue of old ice extending into the Beaufort Sea with first-year ice further north within the Canada Basin has been the typical pattern since 2009. Prior to then, the entire region was covered predominantly by old ice. Compared to spring 2011, the old ice in the Beaufort Sea in May 2012 appears to be somewhat more consolidated and older overall (which typically implies thicker ice), with more ice of three years of age or greater and less first-year ice mixed in. The age data also suggest that the old ice is closer to shore along the Alaskan coast than last year and also extends further into the Chukchi Sea. On the other hand, the eastern Beaufort Sea and Amundsen Gulf show less old ice than in 2011. Even though the age maps suggest that Beaufort Sea ice is older than last year, we anticipate that much of the area of multiyear ice in the Beaufort Sea is likely to melt out, although some residual, scattered multiyear floes may remain. This lack of survival of multiyear ice has been typical of the last several summers and appears to represent a basic change from years past. In part this pattern is driven by reductions in the thickness of ice exported into the region from the high Canadian Arctic. On the other hand, if this Beaufort Sea ice were to survive summer melt, then it would drive a reestablishment of a more extensive multiyear ice pack similar to years past. We expect that the first-year ice in the northern Beaufort Sea and southern Canada Basin will melt out as well, but it will be interesting to see if the areas of second-year ice in the northern Canada Basin and East Siberian Sea are able to survive the summer and replenish the coverage of the older ice types.
We are very pleased to supplement the Maslanik figure with data from the recent NASA-sponsored "IceBridge" flights. A sea ice thickness product by Nathan Kurtz, Michael Studinger, and Sinead Farrell is shown in Figure 5. While there are high values near the Greenland coast, offshore the values are variable along the aircraft flight tracts. Sea ice was generally thin (
Andy Mahoney and Hajo Eicken have added some first impressions of the overall implications of the IceBridge flight data, drawing on additional information from airborne electromagnetic thickness measurements and other surveys, coordinated in conjunction with IceBridge and the Arctic Observing Network (see: http://www.arcus.org/search/seaiceoutlook/ice-thickness-data).
Sea ice less than one year old was somewhat thicker than has been observed in recent years, with a modal thickness around 1.8 m, after one of the coldest North American winters in recent years. Relatively large expanses of older, multiyear ice were observed in the Beaufort Sea with a modal thickness around 3.6 m, which was also somewhat thicker than has been observed in this region recently.
However, isolated multiyear floes were also observed that were little thicker than the first year ice surrounding them. Thus, the data indicate a continued trend towards flushing of old multiyear ice out of Canadian Basin into the Beaufort and Chukchi Seas.
Conditions from the Pacific Arctic (September 2011) illustrate the multiple processes involved in maintaining high sea temperatures in the newly sea ice-free areas north of Alaska (Figure 6).
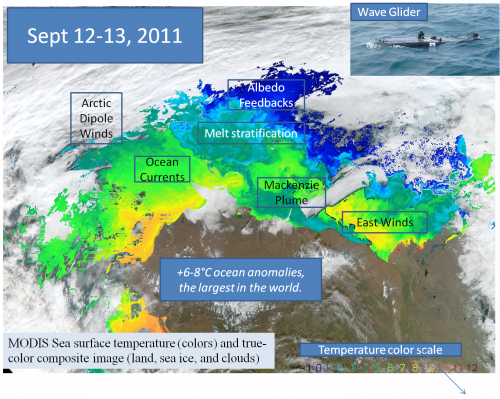
In addition to the loss of old thick sea ice, the increased mobility of sea ice in the Beaufort Sea is consistent with the high sea ice mobility seen in the Atlantic sector by the drift of the "TARA" during the DAMOCLES experiment (Gascard, EOS, Vol. 89, Jan. 2008).
LATE SPRING 2012 CONDITIONS
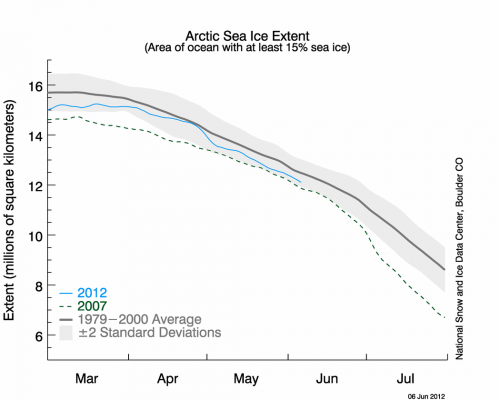
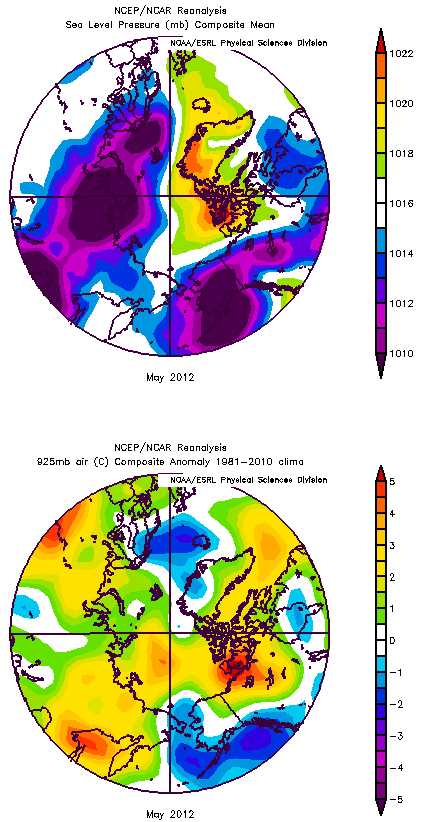
According to Hajo Eicken and Jim Maslanik, sea ice is marginally thicker in spring 2012 on the North American side. Figure 7 shows a loss of sea ice extent through May 2012 (National Snow and Ice Data Center). Sea ice was extensive in April but rapidly decreased in May. The change in May is explained by the sea level pressure (SLP) and air temperature anomaly field for May (Figure 8, top). The SLP field shows the new emergent climate pattern from the last five years of the Arctic Dipole (AD), which has low pressure on the Siberian side of the Arctic and higher pressure on the North American side. May had the main center of the High over northeastern Canada. Since the winds generally follow the pressure contours, this pattern advected warmer air into the Pacific Arctic in both the Beaufort and East Siberian Seas (Figure 8, bottom). The AD pattern was prevalent for all summer months in 2007. In more recent years it has been present for some but not all summer months. For 2012, the AD pattern may be weakening in June, according to the Climate Prediction Center's 8- to 14-day forecast. We should have another interesting season this year as sea ice is more extensive at the end of May 2012 than in the previous two years, while the September Outlooks are slightly more aggressive in projecting lower values; stay tuned for next month's Outlook in July.
KEY STATEMENTS FROM INDIVIDUAL OUTLOOKS
Key statements from the individual Outlook contributions are below, summarized here by first author, Outlook value (rounded to tenths), error estimate (if provided), method, and abstracted statement. The statements are ordered from lowest to highest outlook values. Each complete individual contribution is available in the "Pan-Arctic Individual PDFs" section at the bottom of this webpage.
Andersen, 4.1, Statistical
I use only a single ratio value, that is the ratio between the winter maximum and autumn minimum area/extents. With the record low value of sea ice minimum in 2007 the ratio jumped to about 0.7. We clearly see that, in spite of large variations in both winter and summer values, that the ratio remains stable at this high value. This clearly indicates a shift in standard, perhaps a new paradigm.
Morison, 4.2, Heuristic
First impressions from our 2012 North Pole Environmental Observatory (NPEO) deployment and initial Seasonal Sea Ice Zone Reconnaissance Survey (SIZRS) are that there is quite a bit more snow on the ice than in the last few years and there is more ocean heat than ever right below the mixed layer. Thus, even though the ice extent is about equal to the long term average right now, for summer weather typical of the past few years, the decline in ice area will be more rapid than in other years. I think this may show up initially in unusual declines in concentration in the northern Canada Basin and in the eastern part of the Amundsen Basin.
Hamilton, 4.3 (range 3.4-5.1), Statistical
This is a naive model proposed at the start of the 2012 melt season. Most trend-line analyses of
arctic sea ice have used linear, quadratic, exponential or logistic models. The Gompertz curve appears preferable to these alternatives in several respects.
Randles, 4.3 +/-1.1, Statistical
This method attempts to predict the residual from a Gompertz fit of NSIDC average September Extent by linear regression using the residual from a Gompertz fit of Cryosphere Today area at 31May.
Lukovich et al., 4.3, Heuristic
Similarity in stratospheric dynamical conditions and their anomalies in February 2012 to those encountered during years associated with a record low in fall sea ice extent (2007 and 2011) manifested in the tripolar configuration pattern in wind extrema at high latitudes (Figures 1 and 2) and dissimilarity during years that exhibited a partial recovery in ice extent (2009) suggests a continued decline in sea ice extent during summer from atmospheric dynamical contributions as springtime stratospheric anomalies propagate to the surface. Furthermore, dissimilarity and a continued loss in coherence in sea ice drift patterns in March 2012 relative to March 2007 and 2011 suggests that spatiotemporal variability in fall ice extent will be governed by local ice conditions and ice-ice interactions as monitored by small-scale properties associated with sea ice deformation. Investigation of sea ice concentrations support this hypothesis with the emergence of lower ice concentration bands in the southern Beaufort Sea in May 2012 within an increasingly heterogeneous sea ice cover in the Arctic.
Arbetter, 4.3, Statistical
The underlying assumption is that this year's summer sea ice conditions can be projected by comparing the conditions at the start and end date in recent years. The statistical relationships are derived from observations of physical values. Two new features of NIC-ARIFS for the 2012 outlook are freezing degree days and global NCEP values.
Grumbine et al., 4.4+/- 0.5, Statistical
I continued the same technique as last year, an ensemble of statistical estimators based on logistic curve growth of open water. The past three years, the method was consistently below the observation. So this year, I attempted a bias correction. To do this, I applied the method to a
forecast estimate for each of the past ten years, using all data to the year before.
Keen et al., 4.4 +/-0.9, Modeling
This projection is based on results from the UK Met Office seasonal forecasting system GloSea4. Our projection is based on forecasts initialised between 12th March and 1st April 2012 inclusive (the choice of start dates is discussed in section 5 below), bias-corrected using hindcasts initialised on 9th and 17th March, and 1st April.
Folkerts, 4.4 +/-0.2, Statistical
For each year, monthly data up to 24 months before the September minimum extent was organized and correlated with the minimum extent. Multiple regression analysis was also performed on a variety of combinations, seeking sets of data that correlate well, while trying to avoid overfitting.
Zhang and Lindsay, 4.4 +/-0.5, Modeling
The predicted ice edge in the western Arctic in 2012 is close to that observed in 2011, while the predicted ice extent in the eastern Arctic is smaller than in 2011 (Fig. 2). These results are obtained from a numerical ensemble seasonal forecasting system. The model is the Pan-Arctic Ice-Ocean Modeling and Assimilation System (PIOMAS, Zhang and Rothrock, 2003). The ensemble consists of seven members each of which uses a unique set of NCEP/NCAR atmospheric forcing fields from recent years. In addition, the recently available IceBridge and helicopter-based electromagnetic (HEM) ice thickness quicklook data are assimilated into the initial 12-category sea ice thickness distribution fields.
Stroeve et al., 4.6 (range 4.1-5.2), Statistical
NSIDC is using the same approach as the last 2 years: survival of ice of different ages based on ice age fields provided by Mark Tschudi (Univ. Colorado, Boulder) based on the ice age algorithm of Fowler et al. (2003). Using this approach and taking into consideration that the survivability of ice during the summer melt season has changed in recent years, gives us an average estimate of 4.59 106km2, using ice survival rates from the last 5 summers.
Cawley, 4.6 +/-1.0, Statistical
The projection is purely statistical, using a Bayesian technique known as Gaussian process regression (similar to Krigging). A nice feature of this model is that the credible interval on the projection widens as the projection extrapolates away from the data.
Beitsch et al., 4.7 +/-1.3, Statistical
The KlimaCampus's outlook is based on statistical analysis of satellite derived sea ice area. We introduced the following method: use of near-real-time (SSMI/S) sea ice concentration data combined with long data sets (SSM/I: 1992-2011), a time-domain filter that reduces observational noise, and a space-domain selection that neglects the outer seasonal ice zones.
Chylek, 4.7 +/-0.1, Statistical
Correlation matrix based on the ice extent in early part of the year and on the speed of melting
Canadian Ice Service, 4.7, Multiple Methods
As with CIS contributions in June 2009, 2010, and 2011, the 2012 forecast was derived using a combination of three methods: 1) a qualitative heuristic method based on observed end-of-winter arctic ice thicknesses and extents, as well as an examination of Surface Air Temperature (SAT), Sea Level Pressure (SLP) and vector wind anomaly patterns and trends; 2) an experimental Optimal Filtering Based (OFB) Model, which uses an optimal linear data filter to extrapolate NSIDC's September Arctic Ice Extent time series into the future; and 3) an experimental Multiple Linear Regression (MLR) prediction system that tests ocean, atmosphere and sea ice predictors.
Wu et al., 4.8 +/-0.2, Modeling
The one we submit here is based on the correction of ice thickness initial condition due to too thick ice in the real time CFSv2 initial condition. In our 2010 SIO estimate, it was found that the CFSv2 sea ice extent seemed too excessive (due to too thick ice in the initial condition), and the extent confined within 60 cm of ice thickness matches the real time observation. Based on last year's estimate, the initial condition change (thinning the ice pack by 60 cm) did appear to have improved the model's behavior and skill.
WattsUpWithThat.com, 4.9, Heuristic
Website devoted to climate and weather polled its readers for the best estimate of 2012 sea ice extent minimum by choosing bracketed values.
Wang et al., 4.9 +/-0.4, Modeling
The outlook is based on a real time CFSv2 ensemble of 40 members initialized from May 21-30, 2012. The model's systematic bias, forecast RMS errors, and anomaly correlation skill are estimated based on its historical forecasts for 1982-2011. The CFSv2 has shown long-term decrease of sea ice extent during the past 3 decades, as in the observation. The CFSv2 was also found to have some skill in predicting year to year variability at seasonal time scales.
Blanchard-Wrigglesworth et al., 4.9 +/-0.6, Modeling
Our forecast uses a state-of-the-art General Circulation Model (GCM) initialized with spring 2012 sea ice area and volume anomalies from the Pan-arctic Ice-Ocean Modeling and Assimilation System (PIOMAS). The GCM used is the National Center for Atmospheric Research (NCAR)'s Community Climate System Model version 4 (CCSM4) [1] at 1◦ resolution in all components. Our strategy is to initialize the sea ice anomalies with respect to the model mean that are good approximations to actual arctic sea ice anomalies.
| Attachment | Size |
|---|---|
| Andersen93.47 KB | 93.47 KB |
| Arbetter483.05 KB | 483.05 KB |
| Beitsch et al.3.03 MB | 3.03 MB |
| Blanchard-Wrigglesworth et al.2.4 MB | 2.4 MB |
| Canadian Ice Service172.25 KB | 172.25 KB |
| Cawley49.33 KB | 49.33 KB |
| Chylek24.18 KB | 24.18 KB |
| Folkerts82.56 KB | 82.56 KB |
| Grumbine et al.29.13 KB | 29.13 KB |
| Hamilton256.33 KB | 256.33 KB |
| Keen et al.352.05 KB | 352.05 KB |
| Lukovich et al.4.82 MB | 4.82 MB |
| Morison and Untersteiner34.18 KB | 34.18 KB |
| Randles57.64 KB | 57.64 KB |
| Stroeve et al.565.35 KB | 565.35 KB |
| Wang et al.134.23 KB | 134.23 KB |
| WattsUpWithThat.com64.14 KB | 64.14 KB |
| Wu et al.38.87 KB | 38.87 KB |
| Zhang and Lindsay488.72 KB | 488.72 KB |
| Attachment | Size |
|---|---|
| Gerland et al.805.67 KB | 805.67 KB |
| Gudmandsen520.14 KB | 520.14 KB |
| Howell906.77 KB | 906.77 KB |
| Lindsay and Zhang732.28 KB | 732.28 KB |
| Tivy476.63 KB | 476.63 KB |
| Zhang and Lindsay488.72 KB | 488.72 KB |
