SUMMARY
The outlook for arctic sea ice for September 2009, based on May data, indicates a continuation of low pan-arctic sea ice extent and no indication that a return to historical levels will occur. The June Sea Ice Outlook Report is based on a synthesis of 15 individual pan-arctic estimates (plus six regional contributions) utilizing a range of methods; two additional pan-arctic contributions provide background information on recent sea ice observations.
The June Outlook indicates a similar, or slightly increased, extent compared to the 2008 value of 4.7 million square kilometers. However, there is a small but important probability of a major sea ice loss event this year, given that the ice is thinner and younger than previous years, combined with a possibility of atmospheric conditions that cause significant ice retreat.

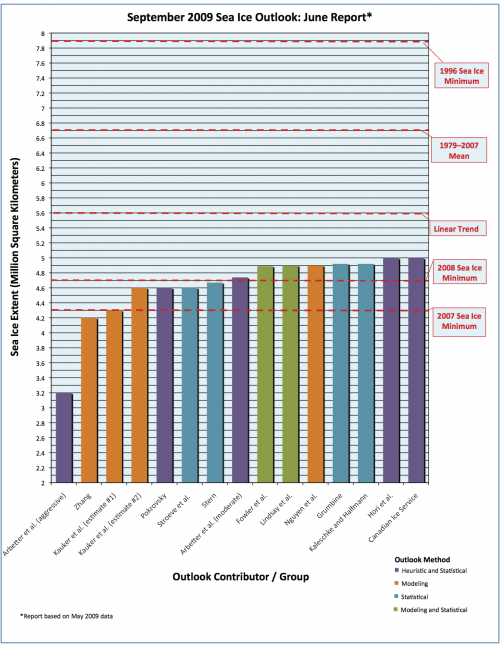
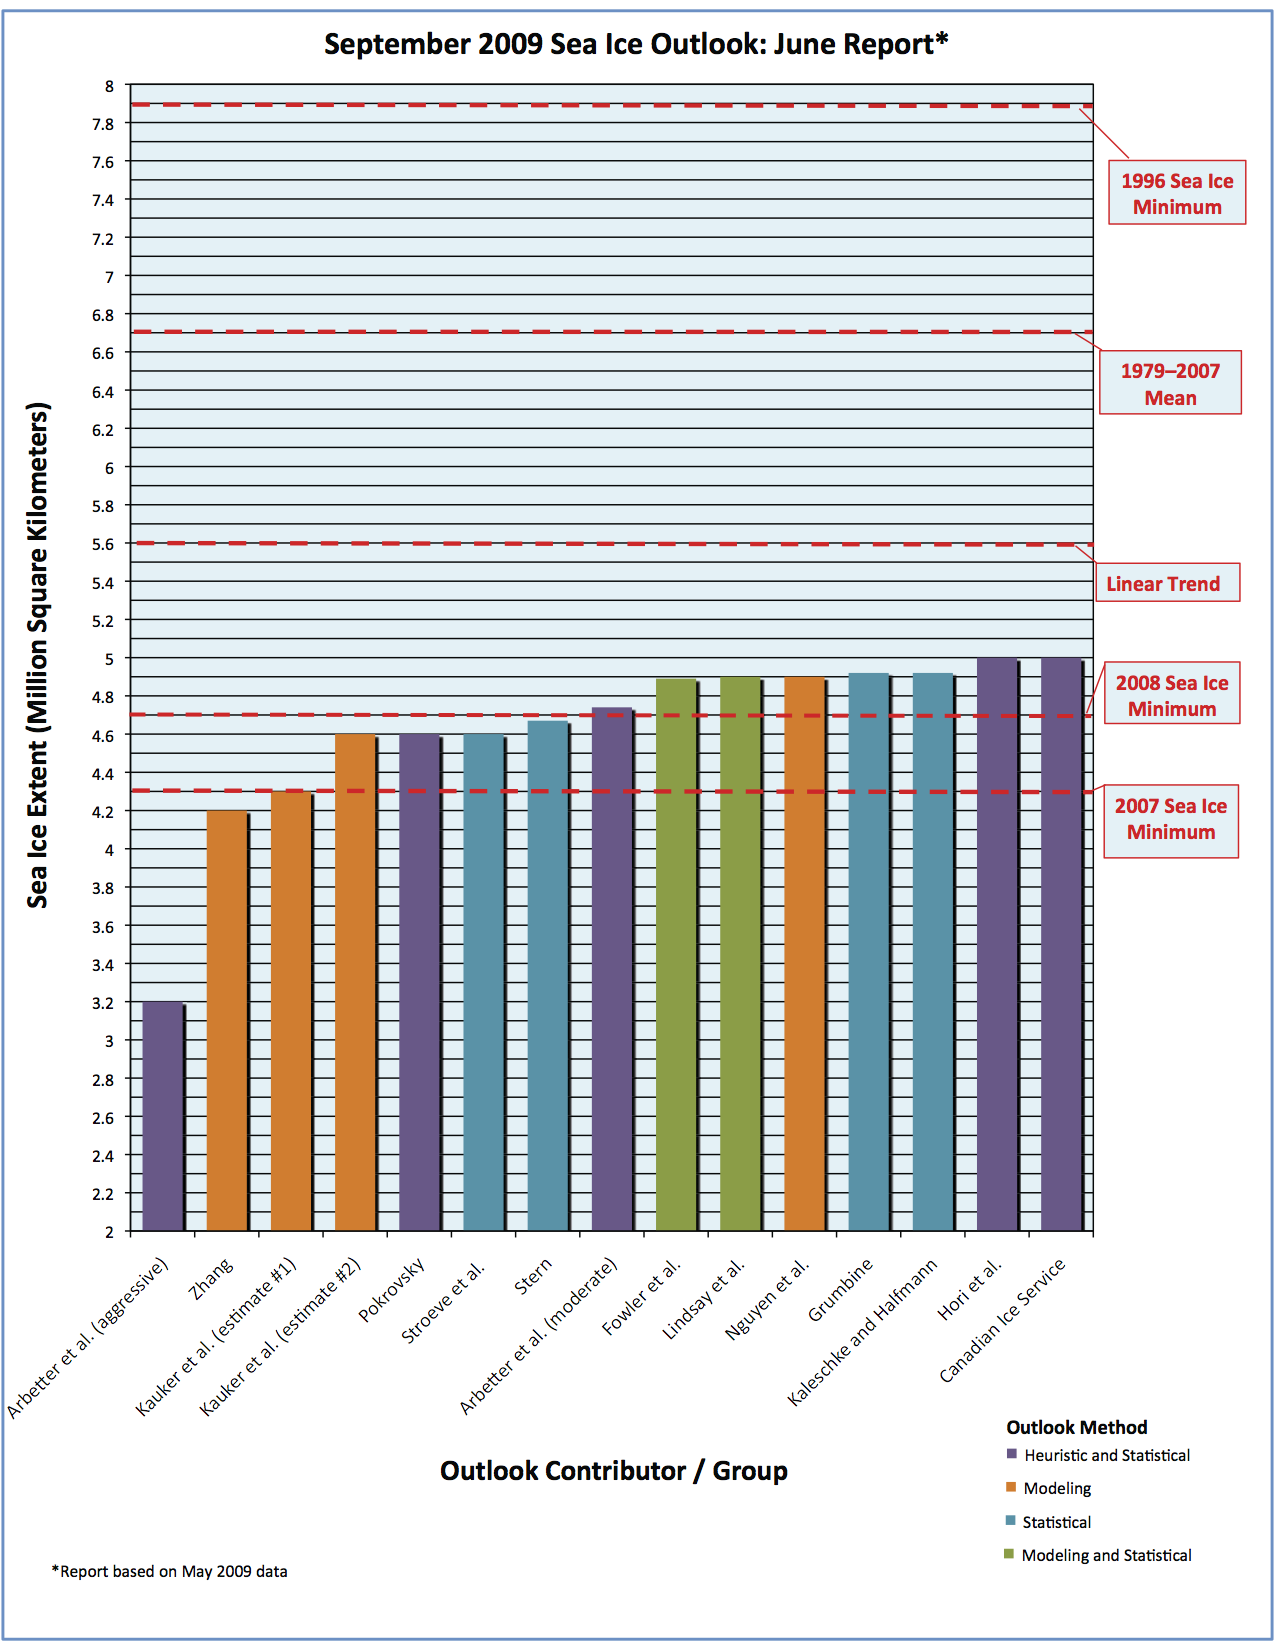
The range of individual outlook values is from 4.2 to 5.0 million square kilometers with an aggressive outlook of 3.2 million square kilometers. All estimates are well below the 1979–2007 September climatological mean value of 6.7 million square kilometers. Half of the responses are in the range of 4.9–5.0 million square kilometers; the remaining estimates are in the range of 4.2–4.7 (Figure 1). The uncertainty / error values, from those groups that provided them, are close to 0.5 million square kilometers, thus many of the values overlap.
Interestingly, the outlook values for the June Report were in fairly close agreement and the range of estimates was much lower than in 2008. This is likely the result of improved and more consistent approaches in the individual outlooks, as the community has applied the insights and lessons learned regarding oceanic and meteorological factors from the 2008 Outlook effort.
FULL REPORT
Status
On 15 May 2009, a request was sent to the contributors of the 2008 Sea Ice Outlook and the broader arctic sea ice community to provide an estimate of mean September 2009 sea ice extent based on May 2009 data. We are pleased to welcome three new groups making contributions. Responses were received by the first week in June. Additional information about the Outlook can be found on the background page.
Approach and Disclaimer
The Sea Ice Outlook provides a forum for researchers to evaluate their understanding of the state of arctic sea ice and for the community to jointly assess a range of factors that contribute to arctic summer sea ice minima. The Sea Ice Outlook is not a formal consensus forecast or prediction for arctic sea ice extent, nor is it intended as a replacement for existing efforts or centers with operational responsibility.
Results
With 15 responses, half represent a mean September Outlook extent estimate of 4.9–5.0 million square kilometers. The remaining estimates had a range of 4.2–4.7 million square kilometers, with an aggressive outlook of 3.2 million square kilometers (Figure 1). As in 2008, the individual responses were based on a range of methods: statistical, numerical models, comparison with previous observations and rates of ice loss, or composites of several approaches; details can be found in the individual outlooks available at the end of this report. The range of estimates for September 2009 sea ice extent is rather narrow, at least compared to the contributions from the 2008 Outlook. Further, the values of uncertainty estimates, from those groups which provide them, are close to 0.5 million square kilometers. Thus, many 2009 Outlook estimates overlap with a consensus value near persistence with the 2008 September mean sea ice extent.

Review of Lessons from 2008
There was a general agreement between Outlook projections and observations in the 2008 effort. The median projected September ice extent from the 2008 May Outlook was 4.2 million square kilometers; the observed 2008 value was 4.7 million square kilometers. These numbers compare to a 1979–2007 climatological mean extent of 6.7 million square kilometers. Moreover, the 2008 Sea Ice Outlook provided a successful forum for community synthesis, an important first step toward better understanding arctic sea ice loss. There was enthusiasm for the project from the larger arctic and climate communities.
A considerable amount of insight was gained from comparing 2007 and 2008 sea ice conditions and the oceanic and meteorological forcing over these summers. A year ago it was uncertain as to whether most first-year sea ice would continue to melt out every year as in 2005 and 2007 (work by Ron Kwok presented at the Outlook Workshop in March 2009). It seems, however, that in years like 2008 with more normal meteorological summer conditions compared to 2007, it is rather difficult for all the first-year sea ice to melt out near the North Pole (see comments by Stroeve et al.). Don Perovich reports that based on ice mass-balance buoys, there was increased bottom melt in regions of low ice concentration such as the Beaufort Sea in both 2007 and 2008. These distributed buoys will be of interest as we move into the 2009 melt season. Initial conditions in May, and especially the 40% loss of multi-year sea ice in the last four years, suggest that that it will be difficult for the sea ice to return to extents of the 1980s and 1990s. Thus, the 2008 Outlooks were correct in estimating sea ice extent well below that of climatology, but some overestimated the amount of first-year sea ice melt back (see comments by the Canadian Ice Service). Model results also suggest that the summer meteorology needs to be supportive as in 2007 to sustain a substantial additional September sea ice loss.
Late Spring 2009 Conditions
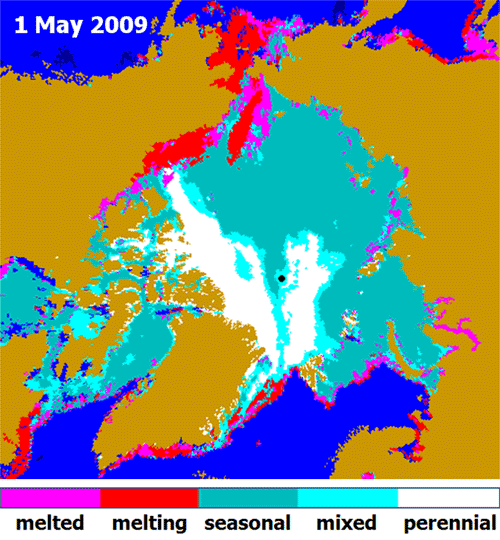
With regards to initial conditions for May 2009, Figure 2 from Nghiem et al. shows the map of sea ice classes derived from QuikSCAT. Their full abstract is added as Appendix 1. Although fall 2008 had almost 0.5 million square kilometers more multiyear sea ice extent than fall 2007, on 1 May 2009, the perennial ice extent had been reduced to 2.1 million square kilometers, which is virtually equivalent to the 2.2 million square kilometers of perennial ice extent on 1 May 2008. The sea ice on the Eurasian side of the North Pole is primarily second-year sea ice remaining from summer 2008; indications are that part of this sea ice exited Fram Strait under the influence of a more positive Arctic Oscillation climate pattern in winter and spring 2009. Figure 2 also suggests regions of earlier than normal melt. Christian Haas and Stefan Hendricks, based on aircraft supported measurements, show continued thick sea ice north of Canada and Greenland. Their results are further presented as Appendix 2. A third set of information is from the Catlin Arctic Survey near 130° W as far north as 85.5° N. Preliminary results suggest that the spatial extent of the thicker multi-year ice is reduced compared with expectations from backscatter data and that the distribution of sea ice types has shifted, favoring both old and young sea ice. More information is available at http://www.catlinarcticsurvey.com/science.


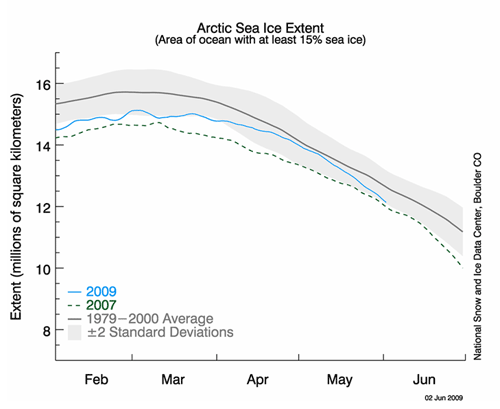
The National Snow and Ice Center (NSIDC) (http://nsidc.org/arcticseaicenews/) noted that although the 2009 melt season started slowly, the pace of sea ice loss quickened through May (Figure 3).
Thus, we can summarize that there is nothing in the arctic sea ice conditions at the end of May that would preclude a major sea ice loss year by September. From the lessons learned by contrasting the meteorology of 2008 with 2007 and from the ensemble runs of the two projects that ran numerical sea ice models with multiple historical years of meteorological forcing, there are many ways (cold followed by warm or warm followed by cold, for example) to arrive at a near average summer forcing with respect to the September sea ice extent. However, there are only a few ways of sustaining three months of forcing favoring ice retreat such as in 2007.
Our Russian colleague (Oleg Pokrovsky) suggests that the greater area of the North Pacific may be turning warm again after a string of cold years. The response is complex. Cold years in the greater Pacific support winds, which in fact were favorable for Pacific arctic sea, ice loss. The sea ice extent in winter and spring 2009 in the Pacific arctic sector has been locally above normal. Both of these factors—local cold temperatures and warmer temperatures farther away—would delay an early sea ice melt. The North Pole Environmental Observatory web camera shows no indication of surface melt well into the third week in June. The NSIDC site notes the warm May throughout the Arctic.
These considerations seem to be reflected in the narrow range of contributions to the 2009 Sea Ice Outlook: reduced sea ice initial conditions at the end of May compared to climatology combined with mean summer meteorological forcing—given the predictive uncertainty in those quantities—suggest persistence or a slight increase in extent in 2009 compared to 2008. However, given the May sea ice state, it is not unreasonable to give a small but important probability of a major sea ice loss event in summer 2009, as noted by the Kauker and National Ice Center (NIC) groups who provide probability distribution estimates.
Key Statements from Individual Outlooks
(Name; estimate in million square kilometers; and method)
Ordered from lowest to highest
Zhang; 4.2 million square kilometers; sea ice model ensemble predictions
The ensemble predictions are based on a synthesis of a model, National Centers for Environmental Prediction (NCEP) and National Center for Atmospheric Research (NCAR) reanalysis data, and satellite ice concentration data. The model is the Pan-arctic Ice-Ocean Modeling and Assimilation System (PIOMAS), which is forced by NCEP/NCAR reanalysis data.
Kauker, Gerdes, Karcher, Kaminski, Giering, and Vossbeck; 4.3 million square kilometers, 4.6 million square kilometers; sea ice model ensemble predictions
We found that ensemble mean and the standard deviation of the predicted summer minimum ice extent depend significantly on the initial state of the ice and ocean. The uncertainty of the prediction was halved when starting at the end of June instead of the end of May. Two approaches are taken, a runup initialization using the model (4.6 million square kilometers) and a data assimilation (4.3 million square kilometers).
Stroeve, Meier, Serreze, and Scambos; 4.6 million square kilometers; statistical, based on ice age survivability
One way to estimate the end-of-summer ice extent is to examine survival rates of ice of different ages in the Arctic. Survival rates of different ice age classes based on ice age data from Maslanik et al. (2007) were used to estimate September ice extent. For 2009, the method predicts an average monthly mean September ice extent of 4.57 million square kilometers. Note, however, that if survival rates from the last few years are used, the 2007 record minimum would be broken in 2009. The last several years have seen persistent summer high pressure patterns, a pressure pattern that is favorable for ice loss. If this pressure pattern were to continue again in 2009, it is possible a new record low would occur given the fact that the ice is even thinner, and, on average, younger this year than in the previous two years.
Pokrovsky; 4.6 million square kilometers; heuristic and statistical
Wind field anomalies generated partly by sea surface temperature (SST) occurred in previous months. Our main attention should be drawn to the North Pacific (NP) area. Spring field observations of SST in 2007 reveal a negative anomaly in the eastern part of the NP and a significant temperature contrast between the east and west parts. That led to generation of an atmospheric high in the eastern part of the NP and a rapid transport of warm air from the south. The April SST field observation in 2009 demonstrates quite an opposite SST anomaly. That suggests a different regime of air circulation in the summer months of 2009. Thus, the ice in the Pacific sector is expected to be near to last year's value.
Arbetter, Helfrich, and Clemente-Colón; 4.7 million square kilometers, 3.2 million square kilometers; statistical/heuristic
Analysis of previous summers indicates that much of the First Year Ice (FYI) will melt. Even with the central pack, only 13% of FYI remained from its March maximum. For this summer, we remove any parcel containing only FYI will melt out regardless of location. Once again, we present four outlook levels of severity. The primary question about summer 2009 continues to be the fate of the FYI in the central Arctic. But for this outlook, we have tied it to the presence of Multi-Year Ice (MYI). The Outlook estimate is for the moderate estimate. An aggressive estimate is 3.2 million square kilometers.
Stern; 4.7 million square kilometers; least squares fit to data
My estimate for September 2009 is based on a linear least squares fit of the past ten Septembers. Interestingly, the estimate is exactly the same sea ice extent as observed in September 2008. In other words, the trend estimate is the same as simple persistence. I believe it is important to include in the Outlook a crude linear extrapolation that can serve as a benchmark against which to compare other, more sophisticated estimates.
Fowler, Drobot, and Maslanik; 4.9 statistical regression and ice age
A key driver for the prediction is extent of ice of different ages. The main points are the relatively small coverage of the older, thicker age classes, and the extent of second-year ice within the central Arctic Basin. In addition, our data suggest a considerable amount of first-year ice mixed in with the second-year ice in this area, perhaps predisposing the region toward greater melt and convergence. A switch to positive North Atlantic Oscillation (NAO) wind patterns could also drive this second-year ice northward, exposing more open water within the central Arctic Ocean, perhaps extending to the vicinity of the North Pole.
Grumbine; 4.9 million square kilometers; statistical
I am viewing the problem as one of growth of open water, rather than decline of ice cover. From this view, ice-albedo feedback is a problem in population growth. As with biological populations, there is a limit to the growth, in that the area of open water cannot exceed the area of ice cover before the growth began. In constructing the statistical estimate, I estimated the 'normal' ice extent (7.39 million square kilometers), computed the open water each year by subtracting the observed cover from 7.39 million square kilometers, and then found a best fit exponential curve to this open water value. Since we are still on the early part of the growth curve, exponential is a fair approximation.
Kaleschke and Halfmann; 4.9 million square kilometers; quadratic extrapolation of the measured September sea ice extent time series
The four different methods are compared in a hindcast experiment to the nine years from 2000 to 2008. The total error is smallest for the quadratic extrapolation of the time series. The combined method yields on average better results than the predictions based on air temperature and on the May extent, but also suffers from larger errors as compared to the extrapolation. Thus, the combined method is not the most suitable approach.
Lindsay, Zhang, Stern, and Rigor; 4.9 million square kilometers; regression of model estimates
Our Outlook forecast of the September mean total ice extent in the Arctic calls for conditions nearly the same as seen in 2008. It is based on model estimates of the mean ice conditions for the month of May and a linear regression model fit to the years 1987 through 2008.
Nguyen, Kwok, and Menemenlis; 4.9 million square kilometers; general circulation model with ensemble atmosphere
The 2006–2008 forcing period covers the extreme 2007 summer condition with anomalously clear skies and wind patterns, which resulted in a large retreat of the arctic sea-ice cover. Thus, we use atmospheric conditions from the last three years (2006–2008) to estimate upper/lower bounds of the arctic sea-ice extent. Using preliminary mid-February to mid-March ICESat-derived thickness as initial sea-ice thickness conditions, our solutions for the September monthly mean sea ice extent are either 4.4 million square kilometers for 2007 atmospheric conditions or 5.5 million square kilometers for 2006 and 2008 atmospheric conditions. Our first guess of the monthly mean sea-ice extent for is the median of these experiments.
Hori, Naoki, and Imaoka; 5.0 million square kilometers; extrapolation from remote sensing
Multi-year ice fraction was estimated from Advanced Microwave Scanning Radiometer–EOS (AMSR-E) brightness temperature data. The fraction of this spring's multi-year ice seems to be the smallest within the recent seven years, although the spring sea-ice extent itself became the largest this May, due to this year's cooler air temperatures. Thus, the spring sea-ice condition is favorable to reduce in summer as we have seen in 2007 and 2008.
Canadian Ice Service; 5.0 million square kilometers; empirical
The Canadian Ice Service (CIS) value was derived empirically, based on the following two factors: 1) the amount of multi-year ice remaining in the Arctic Ocean at the end of May 2009, which was similar to, but slightly less than, the amount remaining at the end of May 2008; and 2) the unexpected formation of a large area of second-year ice over the pole at the end of the 2008 melt season and the new uncertainties associated with this. Predictions for first-year sea ice loss in summer 2008 were for the most part overestimates (especially near the pole, where the large area of second-year ice now exists), leading to new reservations regarding the potential rate of ice loss in summer 2009.
| Attachment | Size |
|---|---|
| Download All Individual June 2009 Outlook Submissions (PDF - 3.5 MB)3.49 MB | 3.49 MB |
| Attachment | Size |
|---|---|
| Zhang323.83 KB | 323.83 KB |
| Kauker et al.947.77 KB | 947.77 KB |
| Stroeve et al.125.07 KB | 125.07 KB |
| Pokrovsky258.21 KB | 258.21 KB |
| Arbetter et al.1.01 MB | 1.01 MB |
| Stern42.92 KB | 42.92 KB |
| Fowler3.73 MB | 3.73 MB |
| Grumbine27.27 KB | 27.27 KB |
| Kaleschke and Halfmann189.34 KB | 189.34 KB |
| Lindsay et al.229.94 KB | 229.94 KB |
| Nguyen et al.34.23 KB | 34.23 KB |
| Hori et al.1.03 MB | 1.03 MB |
| Canadian Ice Service55.95 KB | 55.95 KB |
| Appendix 1 (Nghiem et al.)363.8 KB | 363.8 KB |
| Appendix 2 (Hendricks and Haas)1012.31 KB | 1012.31 KB |
| Attachment | Size |
|---|---|
| Arbetter et al.1.01 MB | 1.01 MB |
| Eicken et al.896.11 KB | 896.11 KB |
| Fowler et al.3.73 MB | 3.73 MB |
| Howell and Duguay530.08 KB | 530.08 KB |
| Pokrovsky260.65 KB | 260.65 KB |
| Zhang28.71 KB | 28.71 KB |


