Outlook Report
Executive Summary
We thank all the groups and individuals who submitted July Outlooks in this 16th year of the Sea Ice Outlook. We also thank NSF for supporting this year's Outlook with funds from NSF award #1331083.
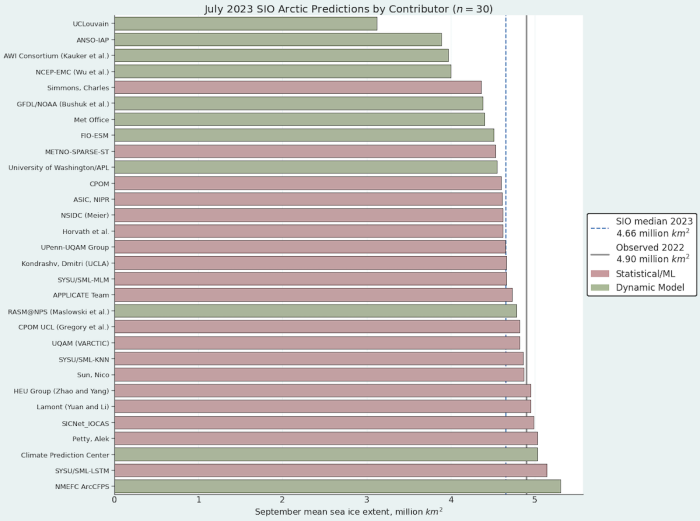
This month we received 30 September pan-Arctic sea ice extent forecasts. Of these, 9 included regional Alaska sea-ice extent forecasts, and 8 included Antarctic sea-ice extent forecasts. The July median forecasted value for pan-Arctic September sea-ice extent is 4.66 million square kilometers with interquartile values of 4.51 and 4.87 million square kilometers, while individual forecasts range from 3.12 and 5.30 million square kilometers. We note the lowest forecast is an outlier, and the only forecast that predicts a new record September sea-ice extent value (current record is September 2012, with a sea-ice extent of 3.57 million square kilometers).
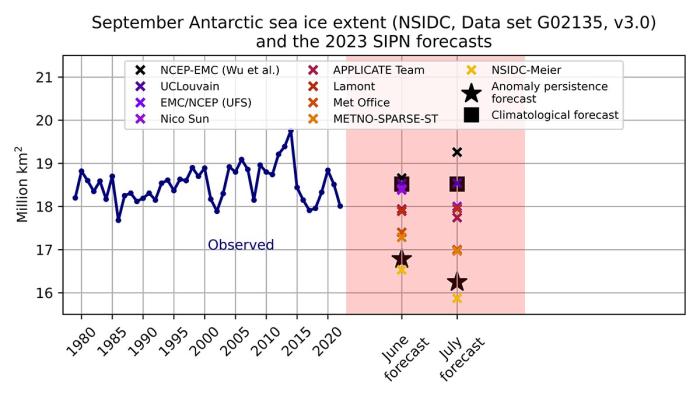
The median Alaska sea-ice extent forecast is 0.55 million square kilometers and the median Antarctic sea-ice extent forecast is 17.85 million square kilometers, which would be the second lowest Antarctic September sea-ice extent on record. Half of Antarctic forecasts predict a record low sea-ice extent (see below for further details).
Compared to the June SIO forecasts, the July median forecast is slightly higher (4.66 million square kilometers vs 4.54 million square kilometers), and the interquartile range is narrower (0.36 million square kilometers compared to 0.56 million square kilometers ), illustrating a lower inter-model uncertainty in the forecasts.
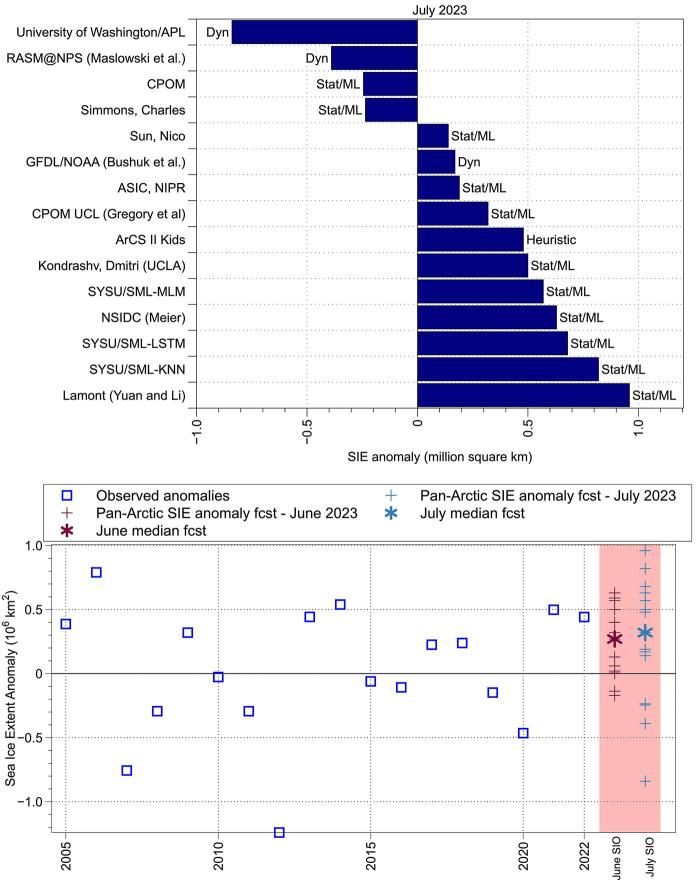
We also received 15 forecasts of September Arctic sea-ice extent anomaly, which is an all-time high number for this metric. The median anomaly sea-ice extent forecast is 0.32 million square kilometers, suggesting that September 2023 sea-ice extent will be slightly above the expected long term linear trend value. Forecasts range from -0.84 million square kilometers to 0.96 million square kilometers, and the interquartile range is 0.75 million square kilometers, significantly greater than the interquartile range for absolute September sea-ice extent mentioned above.
Nine groups submitted supplemental materials (see: Contributor Full Reports and Supplemental Materials below). The supplemental material contents vary among the contributions, but they may include additional figures and information on methodology including (1) how the forecasts are produced; (2) number of ensemble members used in the forecasts; (3) whether and how bias-corrections are applied; (4) ensemble spread, range of forecasts, uncertainties and other statistics; and (5) whether or not post-processing was performed.
This July Outlook Report was developed by lead author Edward Blanchard-Wrigglesworth, University of Washington (Executive Summary, Overview of pan-Arctic forecasts, and discussion of predictions from spatial fields); Walt Meier, National Snow and Ice Data Center (Discussion of current Arctic conditions); Uma Bhatt, University of Alaska Fairbanks (Overview of Alaska regional forecasts, discussion of pan-Arctic anomaly sea-ice forecasts, and ice conditions in the Bering and Chukchi seas); François Massonnet, Université catholique de Louvain (Discussion of Antarctic contributions); Matthew Fisher and the NSIDC Development Team, (statistics and graphs); Betsy Turner-Bogren and Helen Wiggins, ARCUS (report coordination and editing).
Note: The Sea Ice Outlook provides an open process for those who are interested in Arctic sea-ice to share predictions and ideas. The Outlook is not an operational forecast.
See: July Call for Contributions
2023 SIO Forecasts (Pan-Arctic, Alaska Region, Spatial Forecasts, and Antarctic)
Pan-Arctic Sea-Ice Forecasts
Pan-Arctic Sea-Ice Extent Anomalies
This is the third year that the SIO has solicited forecasts of September mean sea-ice extent anomalies. The pan-Arctic anomaly is the departure of the contributors' September extent Outlook relative to their adopted baseline trend (e.g., the trend in historical observations, model hindcasts, etc.). This is motivated by the prospect of reducing SIO extent forecast uncertainty that may originate from models having different trends, mean states, and post-processing methodologies. The 15 anomaly forecasts range from -0.84 to +0.96 million square kilometers, with four below and 11 above the contributors' baseline (Figure 3 top). The observed anomalies range from -1.24 (2012) to 0.79 (2006) million square kilometers (Figure 3 bottom). The pan-Arctic 2023 July SIO anomaly forecast has a median of 0.32 million square kilometers and an interquartile range of 0.65 million square kilometers. Surprisingly, the uncertainty in the July SIO anomaly forecasts is significantly greater than the uncertainty in the June SIO anomaly forecasts.
Alaska Regional Forecasts
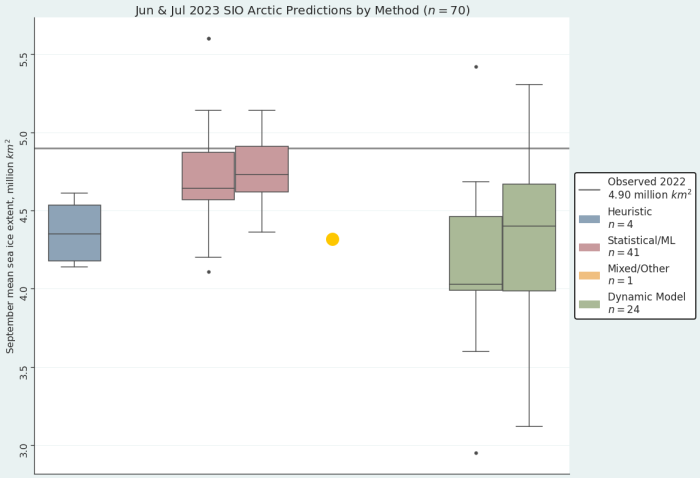
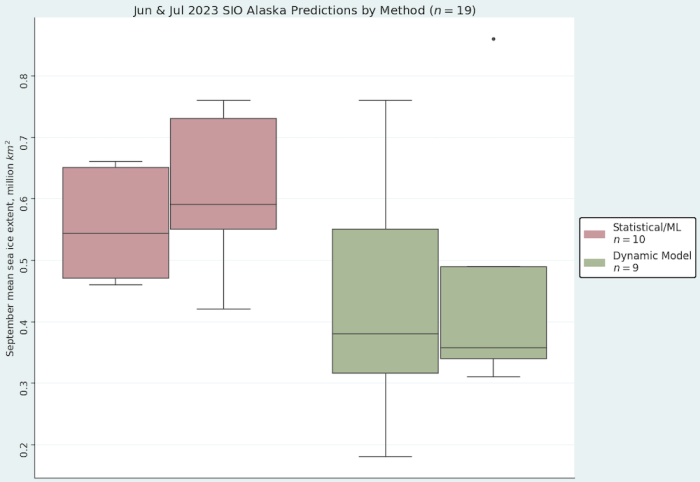
The multimodal median for the July 2023 SIO forecast for the Alaska seas is 0.55 million square kilometers, and a range from a minimum of 0.31 to a maximum of 0.76 million square kilometers (Figure 4). The dynamical model forecasts range from a minimum of 0.31 to a maximum 0.86 million square kilometers with a median of 0.36 million square kilometers. The statistical model forecasts range from a minimum of 0.42 to a maximum of 0.76 million square kilometers with a median of 0.59 million square kilometers. The statistical forecasts display a spread (interquartile range of 0.18) similar to that of the dynamical models (interquartile range of 0.16) (Figure 5). To place these in historical perspective, the September median sea-ice extent for the Alaska seas (Bering, Chukchi, and Beaufort) over 2007–2022 is 0.44 million square kilometers, making the forecast for 2023 slightly above all median observed values (see Figure 3 of 2022 Postseason SIO report.
Pan-Arctic Forecasts with Spatial Methods
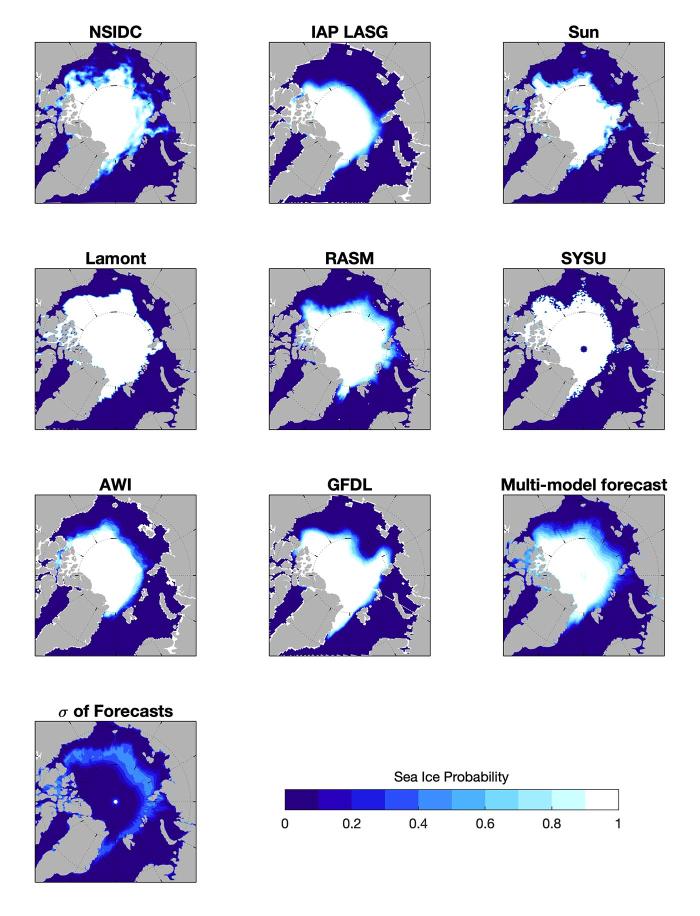
This month we received eight forecasts of September sea-ice probability (SIP, the fraction of ensemble members that project September ice concentration in excess of 15%). Consistent with the June SIP forecasts, July SIP forecasts tend to predict open ocean conditions in the Laptev Sea, although uncertainty remains (e.g., compare the RASM and GFDL forecasts). Forecasts also tend to predict a less prominent East Siberian 'tongue' of September sea-ice (particularly the SYSU forecasts).
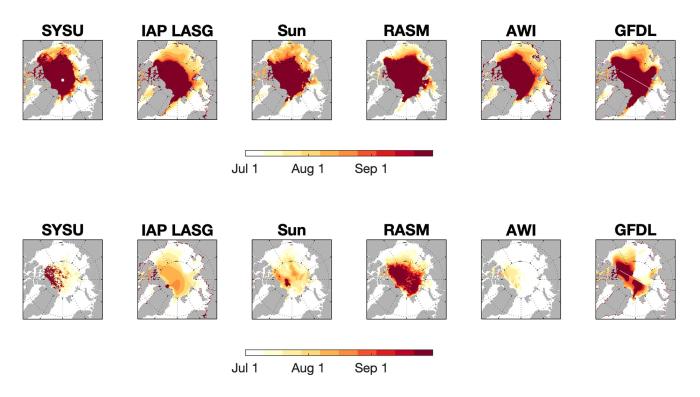
This month we also received 6 forecasts of ice-free date. As seen in the June forecasts, IFD15 is highly uncertain along the coastal areas of the Arctic Ocean. Note for example the contrast in IFD forecasts for the Laptev between the RASM and SYSU forecasts. Interestingly, a majority of models forecast SICs to drop below 80% over most of the central Arctic by the end of the melt period (bottom row), with only two forecasts (RASM and GFDL) forecasting significant areas of SIC greater than 80% to persist through the summer.
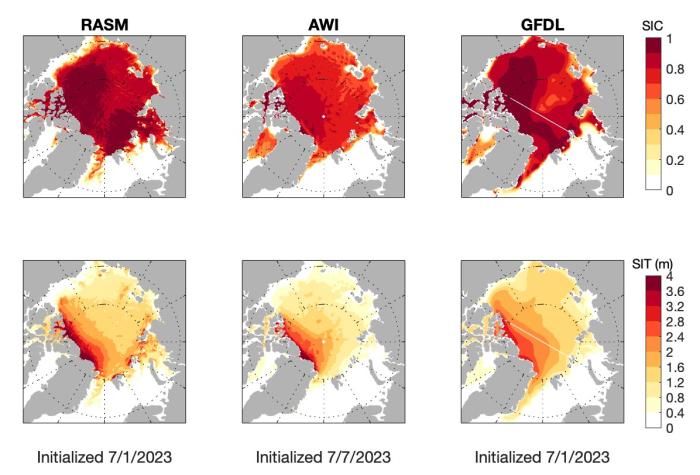
As seen in June, initial conditions are consistent in the large-scale patterns, as forecasts are initialized with thick ice north of Greenland and the Canadian Arctic Archipelago and thinner ice towards Siberia. RASM's forecast is initialized with relatively thick sea ice in the Laptev and Kara seas, which likely helps explain the high SIP/late IFD forecasts from the same model shown above (note how the other two models are initialized with much thinner sea ice in these regions). In terms of SIC initialization, it is interesting to note the pattern in GFDL (and to lesser extent in RASM), which is initialized with relatively low SICs in the North Laptev Sea extending most of the way to the North Pole.
Antarctic Forecasts
As of 16 July 2023, the observed Antarctic sea-ice extent continues to increase at an exceptionally low rate. The value reported by the NSIDC as of 14 July (13.01 million square kilometers) is equal to the value reached on average (1981-2010) on 14 June; that is, the seasonal development of circumpolar Antarctic sea ice is the climatological one lagging by one month. The current sea ice extent anomaly is 17% below average and represents a <-4 standard deviation anomaly, an unseen event as of yet in the satellite record.
Four of the eight Antarctic sea-ice forecasts received for this July outlook anticipate a new record low for September 2023. The anomaly persistence forecast (June sea-ice extent anomaly added to the September average) predicts a record-shattering event. The models that predict above-average conditions are dynamical ones (NCEP-EMC and UCLouvain), and caution should be exercised for these two models given systematic biases in their representation of the Southern Ocean.
With these results and given the latest observational data, we estimate that it is more likely than not that the circumpolar Antarctic mean September mean sea ice extent will reach a record low this year.
Current Conditions
Pan-Arctic Conditions
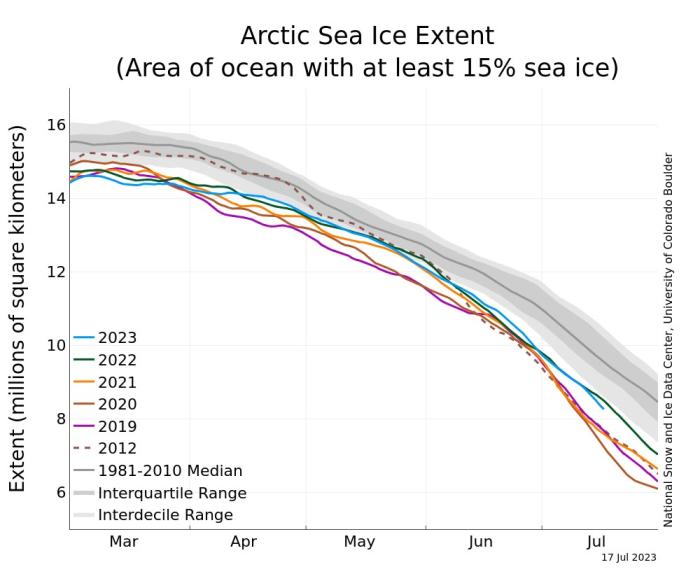
Sea ice extent declined at a near-average rate through June, tracking above the 2012 extent levels, and slightly above last year (Figure 10). In mid-July, the extent loss rate has steepened and extent has dropped below last year, but it remains above 2012.
Note: Figure 10 is from NSIDC Charctic, based on NSIDC Sea Ice Index, Fetterer et al., 2017 and the NASA Team sea ice concentration product at NSIDC (DiGirolamo et al., 2022; Meier et al., 2021).
Sea ice melted out early in Hudson Bay and by mid-July, the bay was essentially ice-free. Ice concentration in the Beaufort, East Siberian, and Laptev Seas was below normal relative to the 1981-2010 median, but this has been typical in many recent years (Figure 11). Sea ice extent was near normal in Chukchi Sea and the Barents and East Greenland Seas. While still ice-covered, a region of lower concentration ice is observed extending to the north and west of the East Siberian Sea. This low concentration region is also seen in higher resolution passive microwave and visible imagery. This an area that may begin melting out in the coming weeks.
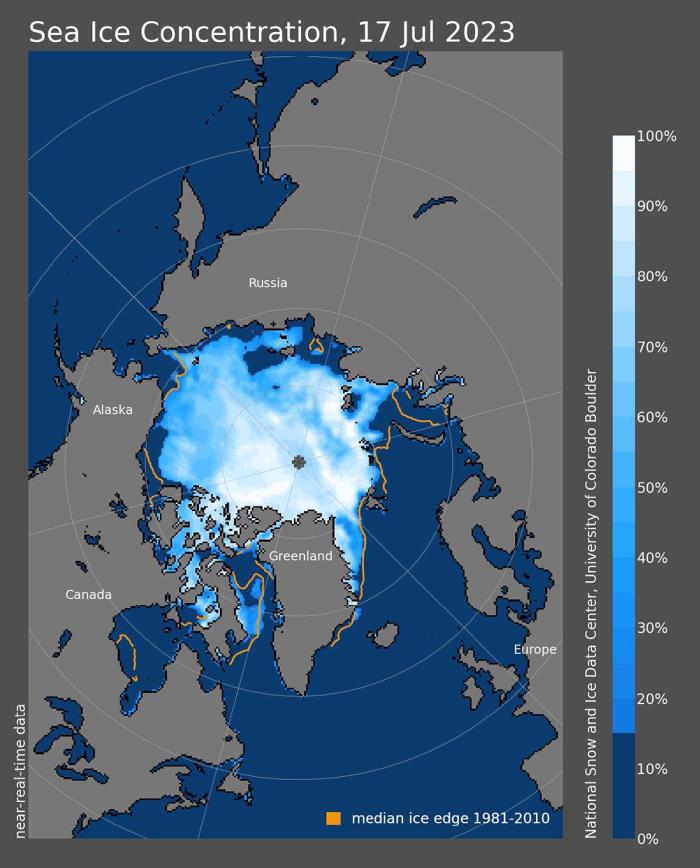
Note: Figure 11 is from NSIDC Arctic Sea Ice News and Analysis, based on NSIDC Sea Ice Index, Fetterer et al., 2017 and the NASA Team sea ice concentration product at NSIDC (DiGirolamo et al., 2022; Meier et al., 2021).
Atmospheric conditions were again moderate during June, continuing the general character from May. Air temperatures at the 925 mb level for June were near normal over most of the Arctic Ocean (Figure 12). Temperatures were 1-2 C lower than average in the Chukchi, Barents and Kara Seas, and up to 4 C below average in Baffin Bay. The only regions with above average temperatures were in the Beaufort Sea, the Canadian Archipelago and Hudson Bay. Beaufort Sea and Canadian Archipelago temperatures were 1-2 C higher than average. Hudson Bay was the "hot spot" for June in the Arctic, with temperatures in the western part of the Bay 4-5 C above average.
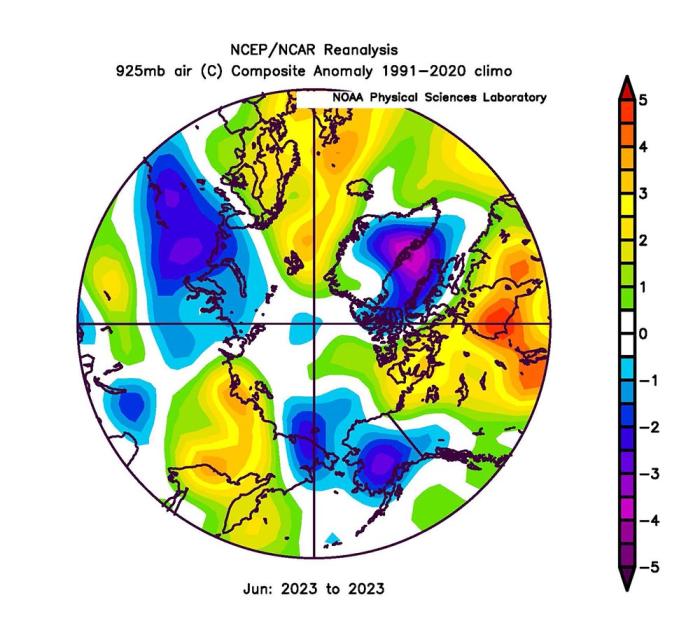
Note: Figure 12 image is provided by the NOAA Physical Sciences Laboratory, Boulder Colorado (Kalnay et al., 1996).
Sea level pressure was generally low over the Arctic Ocean (Figure 13), particularly on the Siberian side of the Arctic. This indicates cloudier than normal conditions, which may have slowed the melt. However, the low pressure brought winds from the south that helped form the open water areas near the coast in the East Siberian and Laptev Seas (as seen in Figure 11) and the reduced concentrations extending to the north and west.
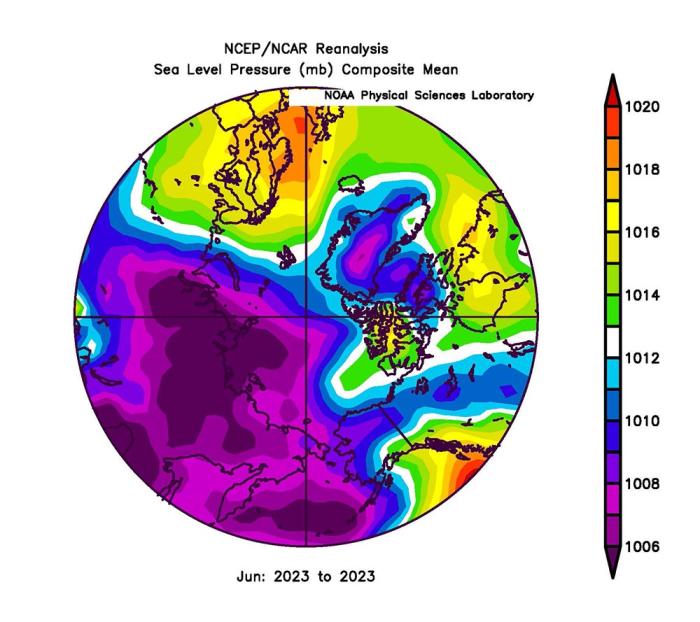
Note: Figure 13 image is provided by the NOAA Physical Sciences Laboratory, Boulder Colorado (Kalnay et al., 1996).
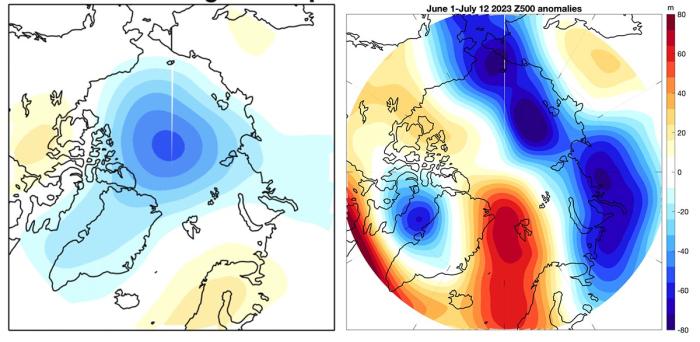
The 500 hPa ('Z500', about 5.5 kilometers up in the atmosphere) geopotential anomalies for 1 June through 12 July 2023 (calculated from the ERA5 reanalysis) show negative anomalies over the Siberian Arctic and positive anomalies over Svalbard and the CAA (Figure 14). The summer pattern of geopotential height anomalies at 500 hPa that covaries with September sea-ice extent can also help account for forecast uncertainty in SIO forecasts, with summers that have low Z500 anomalies tending to have more sea ice (and forecasts that tend to under-predict SIE) and vice versa (Blanchard-Wrigglesworth et al, 2023). In Figure 14 we show the canonical summer pattern, and the so-far (1 June—12 July) observed pattern of Z500 anomalies for summer 2023.
Comparison of 2023 anomalies with the canonical pattern shows them to be mostly orthogonal to each other—in other words, the atmosphere in June-early July 2023 has been fairly neutral in terms of forcing sea ice anomalies of one sign or another, as mentioned above. Therefore, as captured by this metric, the summer weather of 2023 is not expected, as of this moment, to lead to large mean SIO errors (either positive or negative). We will continue monitoring this metric of weather anomalies into August and September.
Alaska Regional Conditions
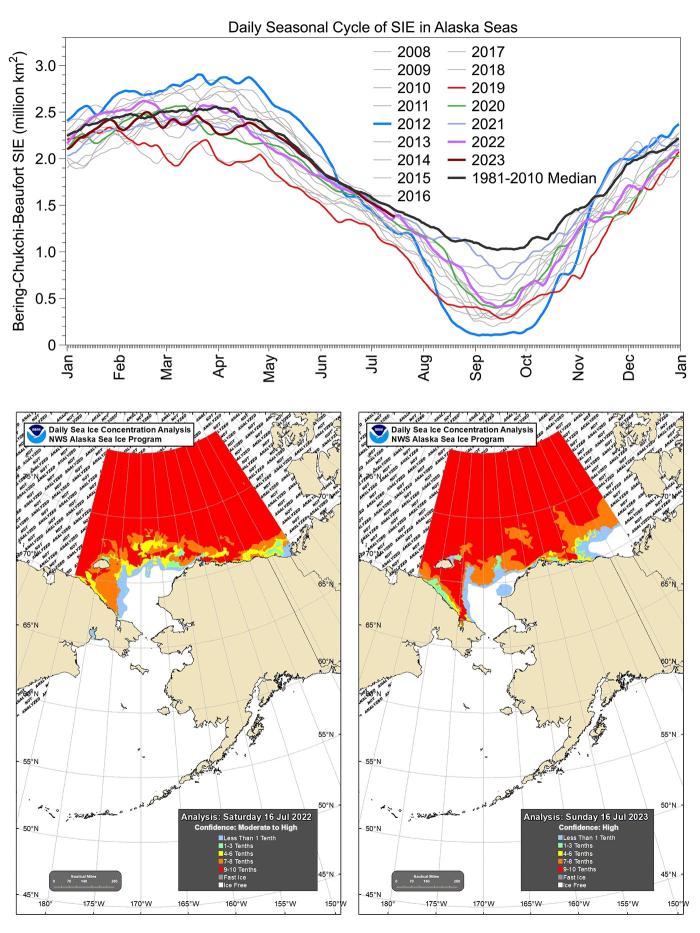
The seasonal cycle of daily sea-ice extent in the Alaska seas in 2023 remained below climatology until May and subsequently has followed climatology into mid-July (1981-2010 median) (Figure 15, top). On 16 July 2023, sea ice is slightly more extensive in the Chukchi Sea and less extensive in the Beaufort Sea compared to a year ago (Figure 15, bottom)
References
DiGirolamo, N., C. L. Parkinson, D. J. Cavalieri, P. Gloersen, and H. J. Zwally. (2022). Sea Ice Concentrations from Nimbus-7 SMMR and DMSP SSM/I-SSMIS Passive Microwave Data, Version 2 [Data Set]. Boulder, Colorado USA. NASA National Snow and Ice Data Center Distributed Active Archive Center. https://doi.org/10.5067/MPYG15WAA4WX. Date Accessed 07-18-2023.
Fetterer, F., K. Knowles, W. N. Meier, M. Savoie, and A. K. Windnagel. (2017). Sea Ice Index, Version 3 [Data Set]. Boulder, Colorado USA. National Snow and Ice Data Center. https://doi.org/10.7265/N5K072F8. Date Accessed 07-18-2023.
Kalnay et al.,The NCEP/NCAR 40-year reanalysis project, Bull. Amer. Meteor. Soc., 77, 437-470, 1996.
Meier, W. N., J. S. Stewart, H. Wilcox, M. A. Hardman, and D. J. Scott. (2021). Near-Real-Time DMSP SSMIS Daily Polar Gridded Sea Ice Concentrations, Version 2 [Data Set]. Boulder, Colorado USA. NASA National Snow and Ice Data Center Distributed Active Archive Center. https://doi.org/10.5067/YTTHO2FJQ97K. Date Accessed 07-18-2023.
Contributor Full Report PDFs and Supplemental Materials
This report was developed by Sea Ice Prediction Network (SIPN) team members.
Report Lead:
Edward Blanchard-Wrigglesworth, University of Washington, Department of Atmospheric Sciences
Additional Contributors:
- Uma Bhatt, University of Alaska Fairbanks, Dept. of Atmospheric Sciences, Geophysical Institute, International Arctic Research Center
- Walt Meier, National Snow and Ice Data Center (NSIDC), Cooperative Institute for Research in Environmental Sciences (CIRES) at the University of Colorado, Boulder.
- François Massonnet, Université Catholique de Louvain (Belgium)
- Matthew Fisher and the NSIDC Development Team, NSIDC, Cooperative Institute for Research in Environmental Sciences at the University of Colorado Boulder
Editors:
Betsy Turner-Bogren, (ARCUS)
Helen Wiggins, (ARCUS)
Suggested Citation:
Blanchard-Wrigglesworth, E., W. Meier, U.S. Bhatt, M. Bushuk, M. Fisher, F. Massonnet, M. Steele, and H. V. Wiggins. Editors: Turner-Bogren, B. and H. V. Wiggins. July 2023. "Sea Ice Outlook: 2023 July Report." (Published online at: https://www.arcus.org/sipn/sea-ice-outlook/2023/july)
This Sea Ice Outlook Report is supported in part by with funds from NSF award #1331083. Any opinions, findings, and conclusions or recommendations expressed in this material are those of the author(s) and do not necessarily reflect the views of the National Science Foundation.
