SUMMARY
The outlook for arctic sea ice in September 2009, based on July data, indicates a continuation of low pan-arctic sea ice extent and no indication that a return to historical levels will occur.
The August Sea Ice Outlook Report is based on a synthesis of 13 pan-arctic contributions (plus nine updates from participating regional groups) utilizing a range of methods.

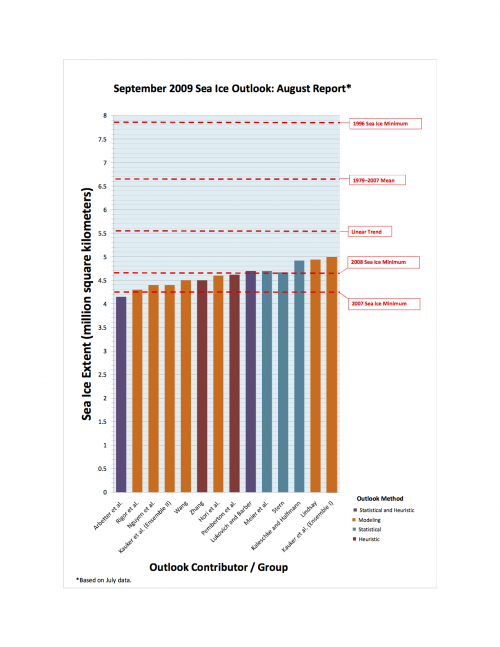
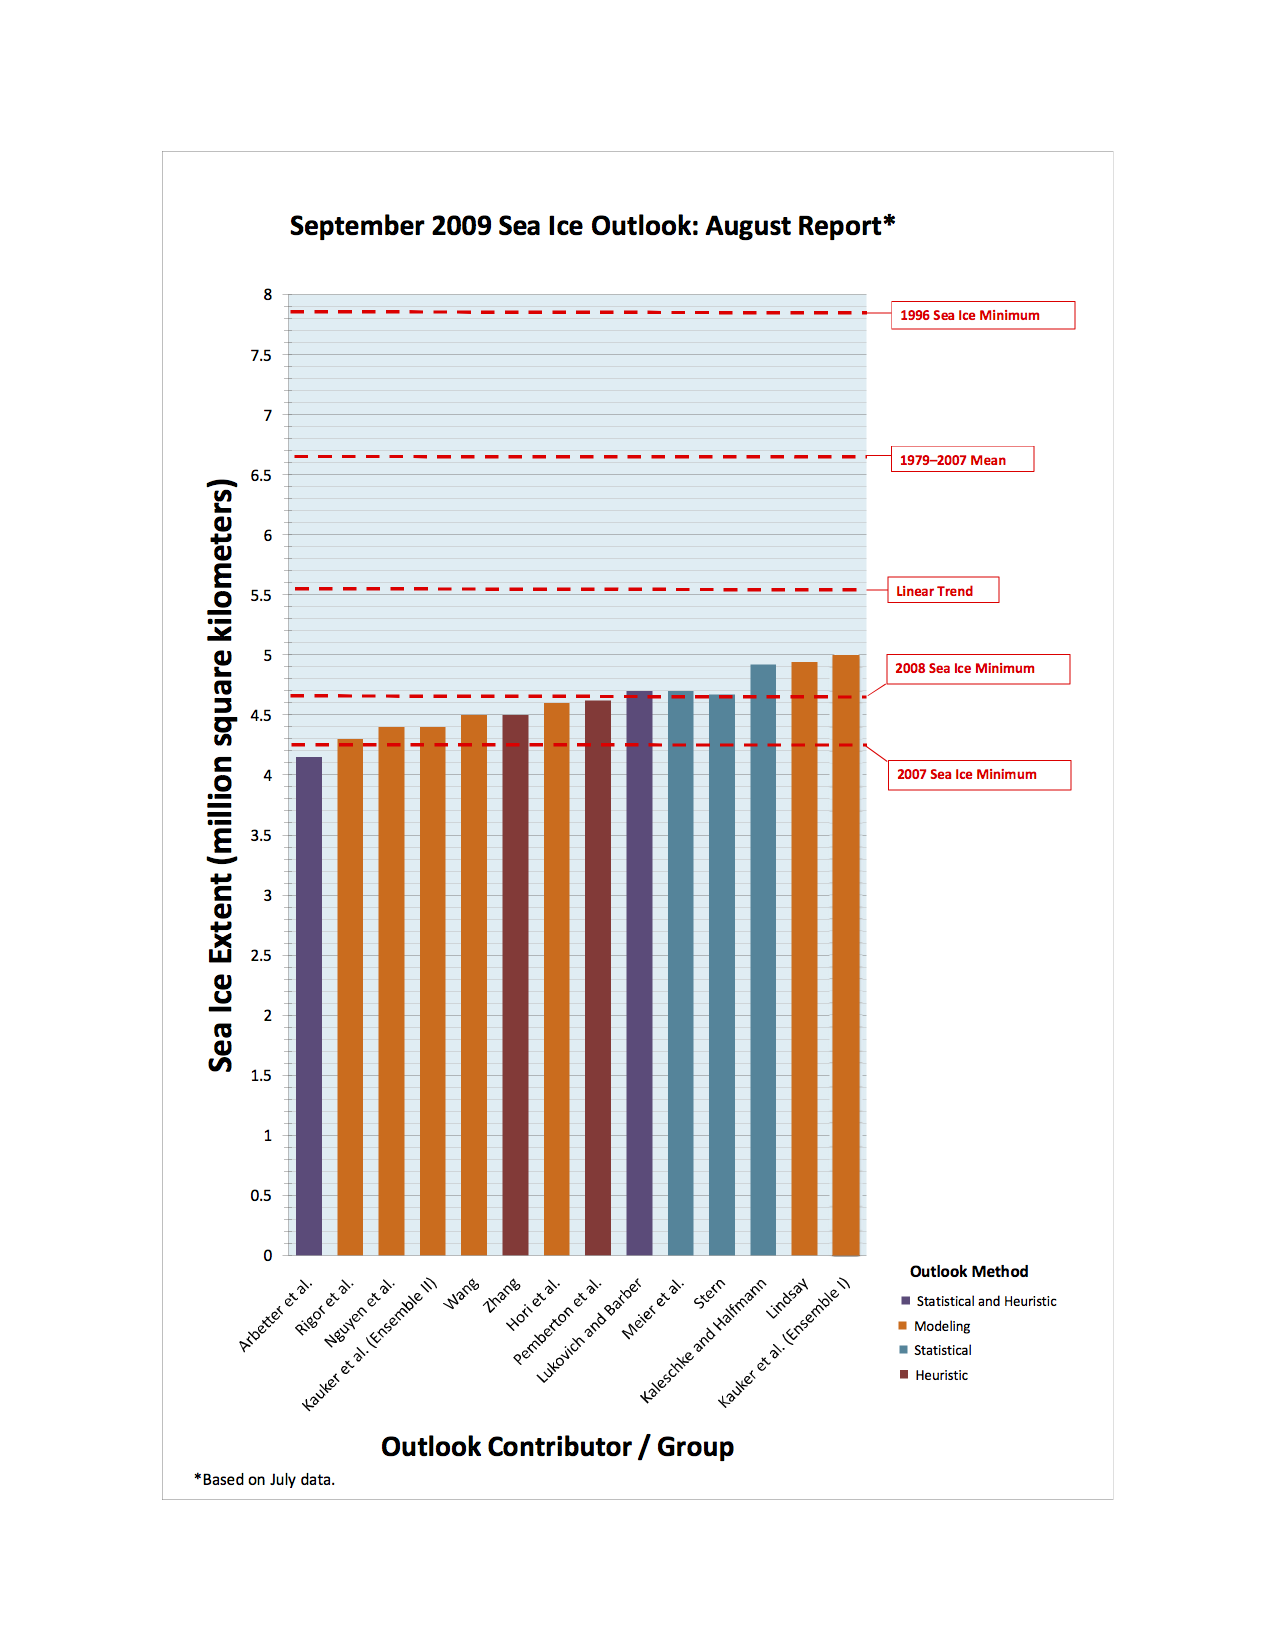
The range of individual outlook values this month is from 4.2 to 5.0 million square kilometers, with more than half of the estimates in a narrow range of 4.4 to 4.6 million square kilometers, representing a near-record minimum. All estimates are well below the 1979–2007 September climatological mean value of 6.7 million square kilometers. The uncertainty / error values, from those groups that provided them, are about 0.4 million square kilometers, thus most of the estimates overlap.
Warm, clear conditions led to significant sea ice melt during the month of July, with some areas of unusually low ice extent and an atmospheric pattern that promotes summer sea ice loss in the Pacific sector of the Arctic. At this point in the sea ice season, the minimum extent will largely be driven by atmospheric conditions, including winds and temperatures.
This August report will be the last formal monthly Sea Ice Outlook this season, though we will provide a short announcement when the sea ice minimum is reached in September. To track the approach to this year's minimum, visit the NSDIC Arctic Sea Ice News and Analysis website, which has daily updates of arctic sea ice.
FULL REPORT
Results
We received 13 responses for the September Outlook based on July data (Figure 1). Estimates for September sea ice extent are in a narrow range (4.2 to 5.0 million square kilometers), as were the Outlooks based on May and June data. As the submitted uncertainty standard deviations are about 0.4 million square kilometers, most of these Outlook expected value estimates overlap. All sea ice extent estimates for September 2009 are much lower than the past climatological extent of 6.7 million square kilometers.

Climate Data for July 2009 and Weather Outlook for August
Also refer to the excellent summary as of 4 August by NSIDC at http://nsidc.org/arcticseaicenews/.
The AMSR-E sea ice extent chart for 10 August (Figure 2) shows sea ice extent is unusually low in the Kara Sea, Baffin Bay, north of western Alaska, and along the Russian coast. QuickScat satellite data shows extensive areas of melt across the arctic sea ice cover (provided by Son Nghiem, see also Regional Outlook for figure and access to more images). The time history of extent (NSIDC, Figure 3) indicates that the average pace of ice loss during July 2009 was nearly identical to that of July 2007. Ice loss sped up during the third week of July and slowed again during the last few days of the month. The sea level pressure pattern for July 2009 (Figure 4) continued from that of June, with high pressure on the Beaufort side of the Arctic and lower pressure over Eurasia. The associated wind pattern is similar to the pattern in summer 2007 that promoted extreme melt, although in 2009 the maximum winds are shifted toward the asian side of the Arctic Ocean. The NSIDC report and a contribution by Hori et al., based on MODIS data, document unusually clear skies during July.
As in 2007, an unusually strong high-pressure cell settled over the Beaufort Sea and low pressure was present over Eurasia during June and July 2009, bringing warm air toward the central Arctic and advecting sea ice toward the pole. This high-low pressure pattern has been referred to as the "Arctic Dipole" climate pattern. With the large areal extent of the Beaufort high pressure in 2009, there are also contributions from the negative phase of the Arctic Oscillation and the positive phase of the Pacific North American climate patterns. Historically, the pattern of sea level pressure during the arctic summer is rather flat. The Dipole has been rare, occurring only 20 and 30 years ago, but it is now seen as more common, present in 2005, 2007, and 2009. The cause for the shift to a more frequent Dipole pattern in recent years is an important scientific question, as this pattern promotes summer sea ice loss in the Pacific sector of the Arctic.

(Credit: http://www.iup.uni-bremen.de:8084/amsr/amsre.html)

(Credit: http://nsidc.org/arcticseaicenews/)

(Credit: http://www.cdc.noaa.gov/cgi-bin/data/composites/comp.pl)
A report from Perovich contrasts the July melt results from two ice mass balance buoys located in the Southern Beaufort Sea and north of Greenland. Through July, the Beaufort buoy had much more surface melt (0.55 m vs. 0.05 m) and bottom melt (0.28 m vs. 0.04 m) than the North Pole buoy. This pattern underscores the difficulty in melting back large stretches of ice at very high latitudes due to the low sun elevation angles, with much less solar heating of ice and surface waters. Looking ahead, surface melt usually begins to wane by mid-August. At the North Pole buoy, large ice concentrations and modest upper ocean heat content indicate that modest additional bottom melting is likely. In contrast, lower ice concentration, significant upper ocean temperature elevation, and a position near the ice edge raised the possibility of significant additional bottom melting at the Beaufort site.
The 8-14 day 500 mb geopotential height and anomaly forecast, valid for 17-21 August (Figure 5), shows a shift from the June-July Dipole pattern to a positive Arctic Oscillation pattern, with low geopotential heights over the central Arctic Basin, bringing to an end the southerly wind flow over the Pacific side of the Arctic Basin. There has been extensive sea ice loss in the marginal seas of the Arctic Ocean. This loss is a recurring feature of the last few years and is seen in the buoy measurements from the Beaufort Sea, supporting the premise that it will be difficult to return to 1990 conditions. The decreases in the NSDIC sea ice timeseries and the presence of the Dipole pattern in June and July, but not much melt activity in the central part of the Arctic Basin, supports a persistence projection from 2008 for September 2009, as represented by the Sea Ice Outlook participants.

(Credit: http://www.cpc.ncep.noaa.gov/products/predictions/610day/500mb.php)
Key Statements from Individual Outlooks
(Name; Estimate in million square kilometers; Method)
Ordered from lowest to highest
Arbetter et al.; 4.2, Heuristic
As was the case last year, the charts represent the parcels of ice that we believe will survive the summer. It does not, however, represent their final location. Drift due to wind and water will transport along the Beaufort Gyre out of the Beaufort and Chukchi Seas. Some ice in the Amundsen Basin will be transported out into the Barents Sea. The distribution of the ice in September 2009 will be very different than the current August 1 conditions. From the spread of prognostications, we believe the moderate case (4.151 million square kilometers) is the most likely.
Rigor et al.; 4.3, Statistical, age estimates
In comparison to 2007 and 2008, there is much more first-year ice in the Beaufort and Chukchi seas in 2009, which we expect to precondition this area for more extensive retreat than in 2007 and 2008. The age of sea ice in the Transpolar Drift Stream is also younger in the areas north of the East Siberian Sea (~80°N 150°E), which also preconditions this area for more retreat compared to previous years. Although there is some first-year ice in the area of the North Pole, this area also gets much less sunlight, thus is less likely to melt out.
Nguyen et al.; 4.4, Model
With JRA25 July 2009 forcings, the model produces less ice loss than those predicted using May and June data. However, there is a systematically higher sea-ice extent of approximately 0.9 million square kilometers in our model results when compared with that from SSMI for both June and July of this year. A closer look shows that the model overestimates sea ice extent in the Laptev, Kara, and Barents seas, consistent with what Kauker et al. reported last month in their report. We correct this month's estimate by 0.9 million square kilometers to arrive at 4.4 ± 0.5 million square kilometers.
Kauker et al.; Ensemble I - 5.0 with a 3% chance to fall below 2007; Ensemble II - 4.4 with a 36 % chance of falling below 2007, Model
Ensemble I starts from the state of ocean and sea ice as it is calculated by a forward run of NAOSIM driven with NCEP atmospheric data from January 1948 to 11 July 2009. Ensemble II starts from an optimized state derived by applying the variational assimilation system NAOSIMDAS (Kauker et al., 2009) for April and May 2009, followed by a one month forward integration (driven with NCEP June 2009 surface data) until 11 July 2009. NAOSIMDAS is being developed in the EU FP6 project DAMOCLES (http://www.damocles-eu.org).
Wang; 4.5, Heuristic
Uses the Dipole Anomaly (DA) index to predict arctic summer ice minima. Using 2009 winter-spring (+0.61) and summer (+1.06) DA indices, now we can project that 2009 summer ice will reach another minimum or at least stay similar to the 2008 level.
Zhang; 4.5, Model
No change from last month's outlook.
Pemberton et al.; 4.6, Model
The probability that the 2009 September mean total sea ice extent will fall below:
- 2007 satellite derived all-time minimum (4.28 million square kilometers) is 21%
- 2008 second lowest satellite derived (4.67 million square kilometers) is 56%
- 2005 third satellite derived (5.57 million square kilometers) is 99%.
Hori et al.; 4.6, Heuristic-remote sensing
Sunny weather was seen over the Arctic Ocean in the former half of this July. It seems to promote sea-ice melting to some extent. Sea level pressure pattern in this June-July period also seems to be getting similar to that in 2007 when the historic sea-ice reduction occurred. However, a lot of sea-ice still remains in East Siberian Sea this year.
Lukovich and Barber; 4.7, Heuristic
An update to differences between surface winds and sea level pressure, and vortex splitting and minimum sea ice extent composites for June 2009 illustrates distinct patterns in the Beaufort, East Siberian, Kara, and Barents seas, and exhibits conditions in June 2009 that are favorable to ice export through Fram Strait, in contrast to those for May 2009. The presence of a sea level pressure high also establishes conditions conducive to ice convergence to the north of the Canadian Archipelago.
Meier et al.; 4.7, Statistical, Heuristic
NSIDC's original assessment of 4.6 million square kilometers, based on the initial amount and distribution of ice age types, remains unchanged. An alternative statistically-based method, using projected rate of sea ice extent decline from previous years' data, was implemented for an updated, complementary estimate. A weighted average, subjectively weighting more recent years higher, was calculated. This approach yields a best estimate of 4.69 million square kilometers, with a range of 4.38-4.91 million square kilometers.
Stern; 4.7, Statistical
No change from last month's outlook.
Kaleschke and Halfmann; 4.9, Statistical
No change from last month's outlook.
Lindsay; 4.9, Model
The anomalous thin ice in the Beaufort Sea and north of the Canadian Archipelago is most influential in making the prediction, but widespread anomalies in this measure contribute to the prediction.
| Attachment | Size |
|---|---|
| Download All Individual August 2009 Outlook Submissions (PDF - 2.2 MB)2.19 MB | 2.19 MB |
| Attachment | Size |
|---|---|
| Arbetter et al.2.08 MB | 2.08 MB |
| Rigor et al.1.84 MB | 1.84 MB |
| Nugyen et al.543.38 KB | 543.38 KB |
| Kauker et al.718.53 KB | 718.53 KB |
| Wang786.94 KB | 786.94 KB |
| Zhang828.32 KB | 828.32 KB |
| Pemberton et al.844.41 KB | 844.41 KB |
| Hori et al.6.53 MB | 6.53 MB |
| Lukovich and Barber728.38 KB | 728.38 KB |
| Meier et al1.34 MB | 1.34 MB |
| Stern588.86 KB | 588.86 KB |
| Kaleschke and Halfmann671.6 KB | 671.6 KB |
| Lindsay667.27 KB | 667.27 KB |
| Attachment | Size |
|---|---|
| Eicken et al.301.64 KB | 301.64 KB |
| Pokrovsky (July Report)78.64 KB | 78.64 KB |
| Perovich126.94 KB | 126.94 KB |
| Fowler, Drobot, and Maslanik (June report)999.3 KB | 999.3 KB |
| Zhang (July Report)575.7 KB | 575.7 KB |
| Gudmandsen et al.608.46 KB | 608.46 KB |
| Howell and Duguay1.03 MB | 1.03 MB |
| Gerland and Goodwin677.33 KB | 677.33 KB |


