Outlook Report
Executive Summary
We express our thanks to all the groups and individuals who submitted their contribution to the 2021 July Sea Ice Outlook (SIO) report and for your continued support.
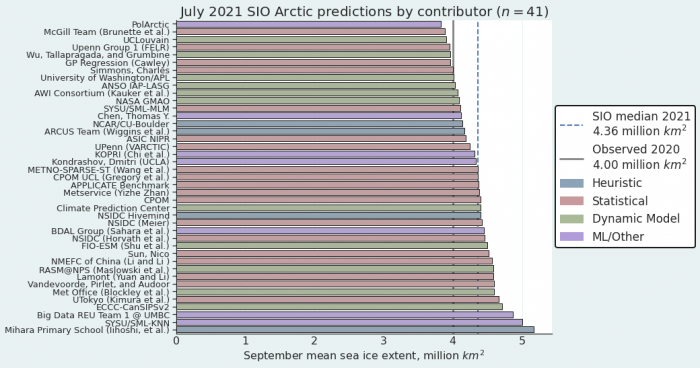
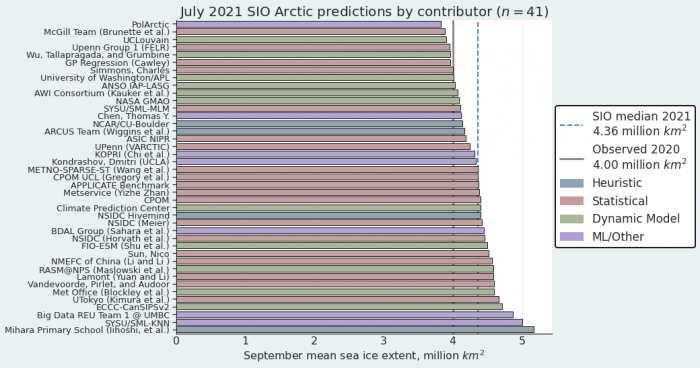
We received 41 contributions of September sea-ice extent that included pan-Arctic predictions—two more than for the June report. Of these, eight also included predictions for pan-Antarctic extent and eight included predictions for the Alaska Region (Bering, Chukchi, and Beaufort seas). There were 14 submissions of September mean sea-ice extent anomalies, computed relative to baseline trends from each prediction method (Figure 1).
This report includes an Overview section and discussions on Current Conditions in the Arctic, Ocean Heat, Predictions from Spatial Fields (Sea-Ice Probability, Ice-Free Date, Initial Conditions), Arctic Regional Sea-Ice Extent, Arctic Sea Ice Anomalies, and Antarctic Contributions.
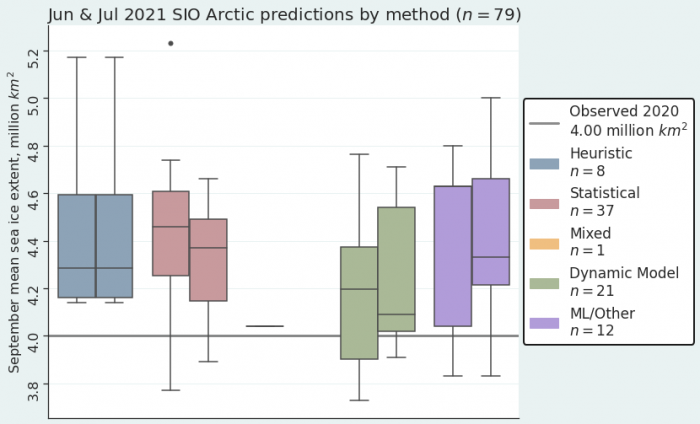
For the Arctic, the median July Outlook for September 2021 average sea-ice extent is 4.36 million square kilometers, essentially identical to the median cited in the June report of 4.37 million square kilometers. The median values for the different prediction methods are 4.20 (Dynamical), 4.29 (Heuristic), 4.46 (Statistical), and 4.63 (Machine Learning) million square kilometers. These are identical to the values listed in the June 2021 outlook. Predictions based on all contributions range from a low of 3.8 million square kilometers to a high of 5.2 million square kilometers, hence spanning about 1.4 million square kilometers. Ranges from the different prediction techniques are also large. The record low September extent over the period of satellite observations was set in 2012 at 3.57 million square kilometers, and the second lowest on record was 4.0 million square kilometers set in 2020. Hence, none of the prediction methods forecast a new record low September ice extent.
Forecasts of Sea-Ice Probability (SIP) and the Ice Free Date (IFD) are based on two thresholds: 15% and 80% ice concentration. Nine SIP forecasts were submitted (seven Dynamical and three Statistical). As was the case for the 2021 SIO June outlook, low SIPs in the Chukchi and Laptev seas are expected. Satellite data indicate that as of this report, the Laptev Sea is already essentially ice free. Also following the June report, all forecasts show an open Northern Sea Route (Northeast Passage). All of the forecasts point to a high probability of ice in the channels of the Canadian Arctic Archipelago; as of this report, the southern route of the Northwest Passage remains choked with ice. As was again the case for the June 2021 report, and also a feature of past years, there is considerable forecast uncertainty in the IFD (eight contributions, six Dynamical, two Statistical) in some regions. Some show ice-free conditions in the Laptev Sea by June, others do not (as noted, this area is presently ice-free based on satellite data). For both ice concentration thresholds, forecasts vary widely in how much of the Arctic Ocean remains ice covered through the end of the melt season.
Starting in 2020, the SIPN2 team invited forecasts of initial conditions of sea-ice concentration and thickness to better understand how observations are being used in forecasts. For the July 2021 SIO, we received four submissions of initial conditions from dynamical models. Sea-ice concentration initial conditions generally show good agreement across the different models. By contrast, thickness initial conditions show less agreement. While all models show thick sea ice north of Greenland and the Canadian Arctic Archipelago, they disagree significantly in the thickness distribution in the Pacific Arctic. Overall, the pattern of better initial conditions agreement of sea-ice concentration compared to sea-ice thickness is consistent with that found in 2020 (See: Predictions from Spatial Fields discussion below).
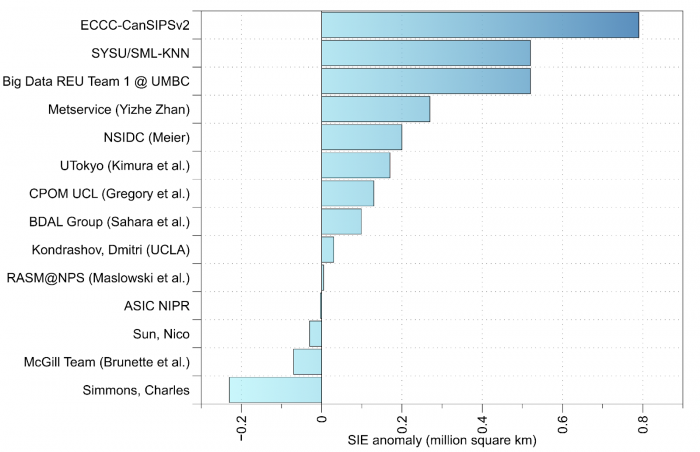
As introduced in the June 2021 report, the SIO is now including September mean sea-ice extent anomalies relative to contributor's baseline trends. This is motivated by the large spread in SIO predictions of mean September sea-ice extent. The intent is to examine if the spread is reduced when the inter-model bias is removed. The 14 contributions of September mean sea-ice extent anomalies range from -0.28 to +0.79 million square kilometers with a standard deviation of 0.27 million square kilometers. The standard deviation is considerably smaller than reported for June (0.57 million square kilometers). Also with June, there are ten forecasts above and four below the contributors' baseline (See: Arctic Sea Ice Extent Anomalies discussion below).
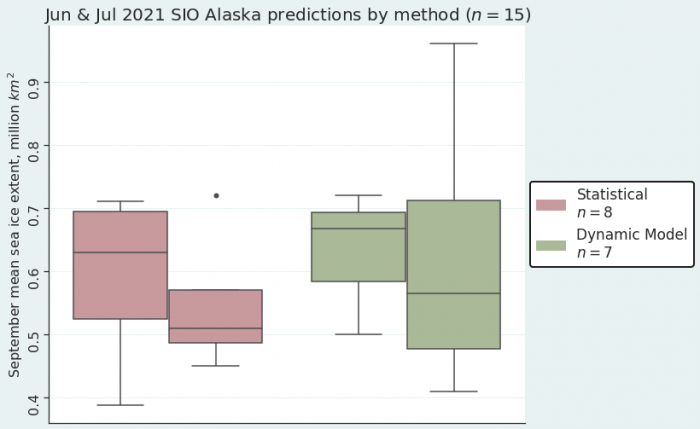
For the Alaskan Region, defined as the Bering, Chukchi, and Beaufort seas, the sea-ice extent median among the eight contributions is 0.51, down from 0.67 million square kilometers from the June forecasts. The dynamical model projections range from 0.41 to 0.96 million square kilometers with a mean of 0.62 million square kilometers. The statistical model projections range from 0.45 to 0.72 million square kilometers with a mean of 0.55 million square kilometers. The dynamical forecasts have a larger spread compared to the statistical models, which is opposite from what was reported in the June 2021 SIO. For perspective, the September mean sea-ice extent or the Alaska region averaged over 2007–2020 is 0.44 million square kilometers, making the forecasts for 2021 above all observed values since 2015. Based on satellite observations, as of this report, sea-ice extent in the Beaufort Sea north of Alaska remains fairly extensive and extent is near average in the Chukchi Sea (See: Regional Sea Ice Extent discussion section).
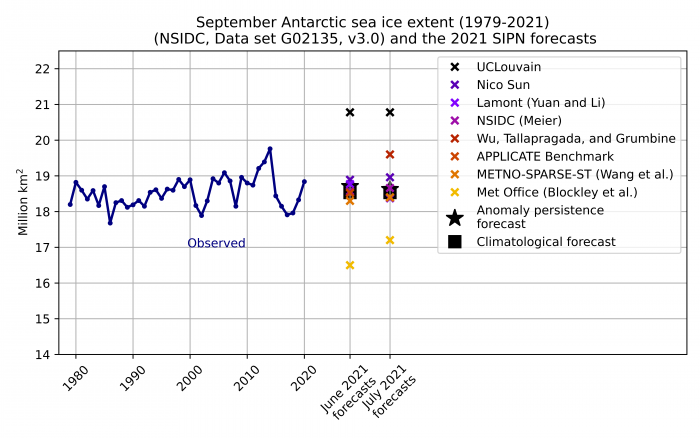
For the Antarctic, seven outlooks of September mean sea-ice extent were received. These outlooks span 17.2 to 20.78 million square kilometers. This is a remarkably large spread, surpassing the range in the observed satellite record and much larger than the spread in the Arctic predictions (See: Antarctic Contributions discussion below).
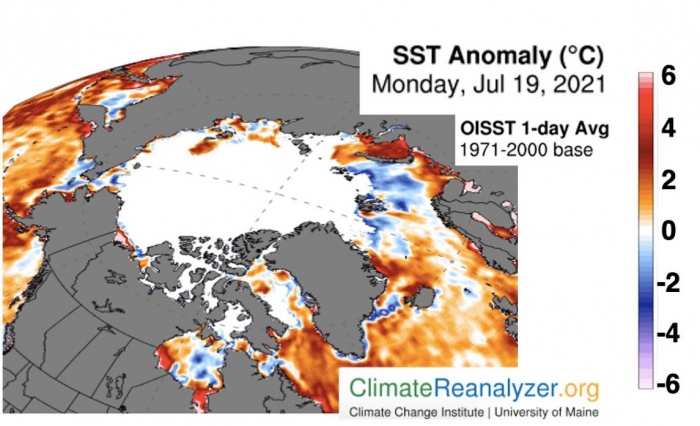
In terms of observed conditions, June 2021 Arctic sea-ice extent tracked close to levels recorded in 2012 for most of June and early July, with a slight slowdown in mid-July. As of 18 July, extent was third lowest for the date: below 2012, but above 2020 and 2019 (Figure 3). The regional pattern continued to be dominated by extensive open water along the Siberian coast, particularly in the Laptev Sea. Also notable is the relatively high ice coverage compared to recent years in the Beaufort and Chukchi seas, due to the advection of multiyear ice into the region. The current trajectory puts the pan-Arctic September sea-ice extent in the same range as in recent years. Sea surface temperatures (SSTs) in most of the Arctic seas are not particularly anomalous in late July 2021. An interesting situation exists in the Laptev Sea and western East Siberian Sea. In most cases, early ice retreat—such as seen this year—is associated with high SSTs. However, for reasons that remain to be determined, SSTs in these areas by late July are not particularly anomalous (See: Current Conditions and see Ocean Heat discussions below).
This July Outlook was developed by lead authors Mark Serreze and Walt Meier, University of Colorado (Executive Summary, Overview, and discussion of Current Conditions); Michael Steele, University of Washington (Ocean Heat Discussion); Uma Bhatt, John Walsh, and Richard Thoman, University of Alaska Fairbanks (discussion of ice conditions in the Bering and Chukchi seas); Cecilia Bitz, University of Washington (spatial field figures; discussion by Uma Bhatt); François Massonnet, Université catholique de Louvain (Antarctic Contributions Discussion and Predicting Predictions); Matthew Fisher, NSIDC (statistics and graphs); Betsy Turner-Bogren, Helen Wiggins, Kuba Grzeda, and Lisa Sheffield Guy, ARCUS (report coordination and editing); and the rest of the SIPN2 Project Team.
Note: The Sea Ice Outlook provides an open process for those who are interested in Arctic sea-ice, to share predictions and ideas; the Outlook is not an operational forecast.
See: July Call for Contributions
Overview
The median of the 41 July 2021 outlook contributions for September Arctic sea-ice extent is 4.36 million square kilometers, essentially identical to the median cited in the June 2021 report. Predictions based on all contributions span a low of 3.8 million square kilometers to a high of 5.2 million square kilometers, a range of about 1.4 million square kilometers (Figure 1). Overall, these numbers have not changed appreciably from those in the June 2021 report. The median values for the different prediction methods are 4.20 (Dynamical), 4.29 (Heuristic), 4.46 (Statistical), and 4.63 (Machine Learning) million square kilometers (Figure 2). Hence, none of the outlooks point to breaking the observed record low September mean sea-ice extent of 3.57 million square kilometers set in 2012 and only a few point to lower September extent than observed in 2020 of 3.92 million square kilometers.
In terms of observed conditions, June sea-ice extent tracked close to levels recorded in 2012 most of June and early July, with a slight slowdown in mid-July. The regional pattern continued to be dominated by extensive open water along the Siberian coast, particularly in the Laptev Sea. Also notable is the relatively high ice coverage compared to recent years in the Beaufort and Chukchi seas, due to the advection of multiyear ice into the region. The current trajectory puts the September pan-Arctic sea-ice extent in the same range as in recent years.
As was the case for the June outlook, low sea-ice probabilities (SIPs) are expected in the Chukchi and Laptev seas. As of this report, the Laptev Sea is already essentially ice-free as seen from satellite images. All forecasts show an open Northern Sea Route (Northeast Passage), but with a high probability of ice in the channels of the Canadian Arctic Archipelago. As of this report, the southern route of the Northwest Passage remains choked with ice. As has been the case in past SIO reports, there is considerable forecast uncertainty in Ice Free Dates (IFDs); some outlooks show ice-free conditions in the Laptev Sea by June, others do not. Outlooks vary widely with respect to the area of the Arctic Ocean expected to remain ice covered through the melt season.
The 14 contributions of September mean sea-ice extent anomalies, computed relative to baseline trends, range from -0.28 to +0.79 million square kilometers. The standard deviation of 0.27 million square kilometers is smaller than reported for June (0.57 million square kilometers). Also with June, there are ten forecasts above and four below the contributors' baseline.
For the Alaskan Region, the combined sea-ice extent median among the eight contributions is 0.51, compared to 0.67 million square kilometers from the June forecasts. The dynamical forecasts have a larger spread compared to the statistical models, opposite from what was reported in the June 2021 SIO. The observed September mean sea-ice extent for the region for from 2007–2020 is 0.44 million square kilometers, making the forecasts for 2021 above all observed values since 2015.
For the Antarctic, seven outlooks of September mean sea-ice extent were received. These outlooks span 17.2 to 20.8 million square kilometers. This is a remarkably large spread, surpassing the range in the satellite record and much larger than the spread in the Arctic predictions (See: Antarctic Contributions).
For the 2021 SIO July report, ten groups submitted supplemental materials (See: Contributor Full Reports and Supplemental Materials below). The supplemental material contents vary among the contributions but they may include information on methodology on: (1) how the forecasts are produced, (2) number of ensemble members used in the forecasts, (3) whether and how bias-corrections are applied, (4) ensemble spread, range of forecasts, uncertainties and other statistics, and (5) whether or not postprocessing was performed.
Current Conditions
June sea-ice extent tracked close to levels recorded in 2012 most of June and early July, with a slight slowdown in mid-July. As of 18 July, extent was third lowest for the date: below 2012, but above 2020 and 2019 (Figure 3). The regional pattern continued to be dominated by extensive open water along Siberian coast, particularly in the Laptev Sea (Figure 4). The extreme here has been at or near record lows since late May. Also notable is the relatively high ice coverage compared to recent years in the Beaufort and Chukchi seas. The current ice edge is near the 1981–2010 median and extends to the coast on the north Alaskan coast near Utqiaġvik. This appears to be due to the advection of multiyear ice (Figure 5) into the region from the central Arctic Ocean and from north of the Canadian Arctic Archipelago. Whether this thick ice will survive the summer melt season bears watching. The current trajectory puts the pan-Arctic sea-ice extent in the same range as the recent years.
Air temperatures at the 925 mb level of the atmosphere averaged from June through the first half of July (Figure 6) were generally above average over the Arctic Ocean through June and early July, with anomalies up to 4℃ above the 1981–2010 average in the Laptev Sea. However, for reasons that remain to be determined, as of this report sea surface temperature in this region is not particularly anomalous. Temperatures were slightly below average over the Kara Sea. The most remarkable atmospheric feature in the Arctic through June and the first half of July was a persistent low sea level pressure pattern over the central Arctic Ocean, centered roughly along 90 degrees east longitude (Figure 7). The central pressure was more than 10 mb below the 1981–2010 average. Such a pattern is not unusual during the Arctic summer, though the center of the low is more commonly found near the date line, the result of cold-cored cyclones moving into the region from Eurasia as well formations within the Arctic Ocean. This pressure pattern resulted in winds blowing ice into the Beaufort and Chukchi seas, which also helped to maintain the higher ice cover in that region. Historically, air temperatures associated with this type of pressure pattern are below average, but that is not the case in 2021.
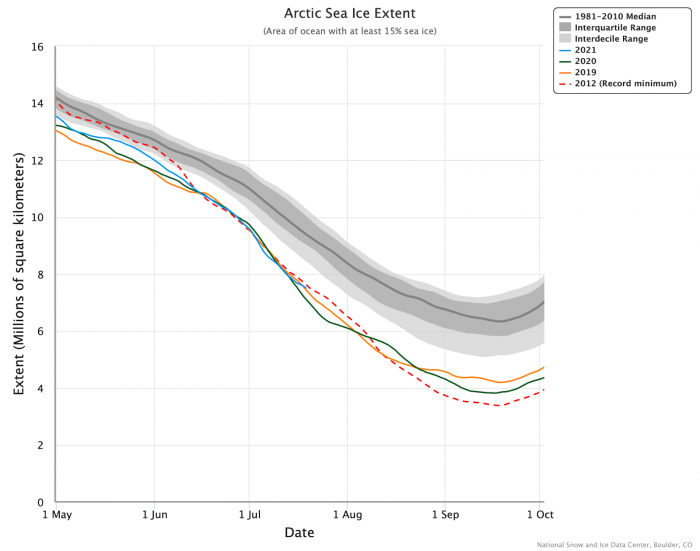
Note: To view updated sea-ice extent, go to: https://nsidc.org/arcticseaicenews.
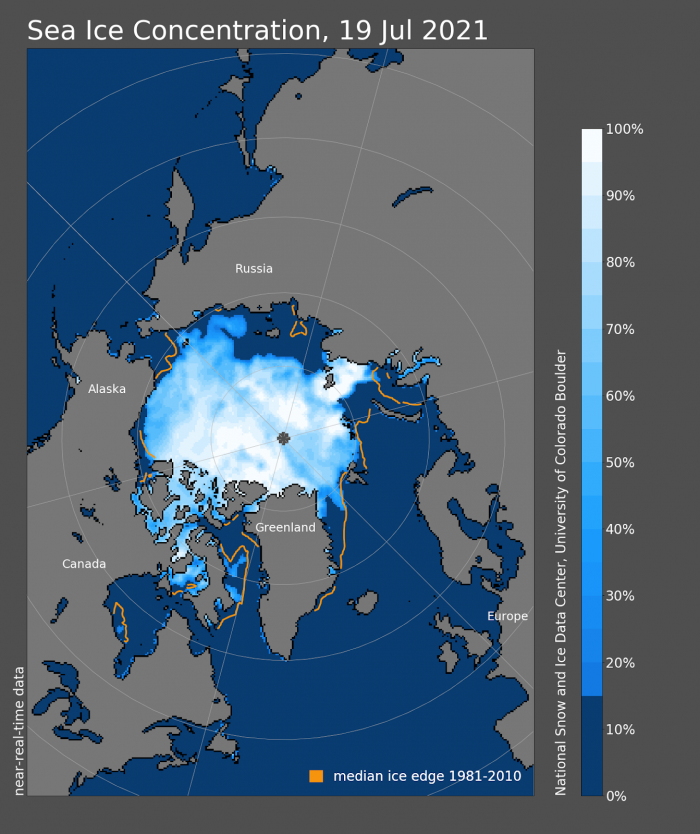
Note: To view updated sea-ice concentration map, go to: https://nsidc.org/arcticseaicenews.
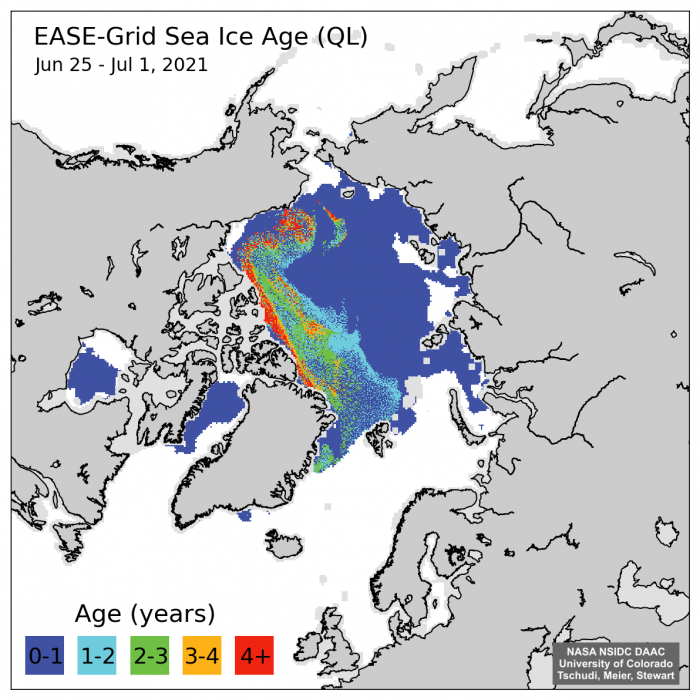
Note: Figure from Tschudi et al., 2019, https://nsidc.org/data/nsidc-0749.
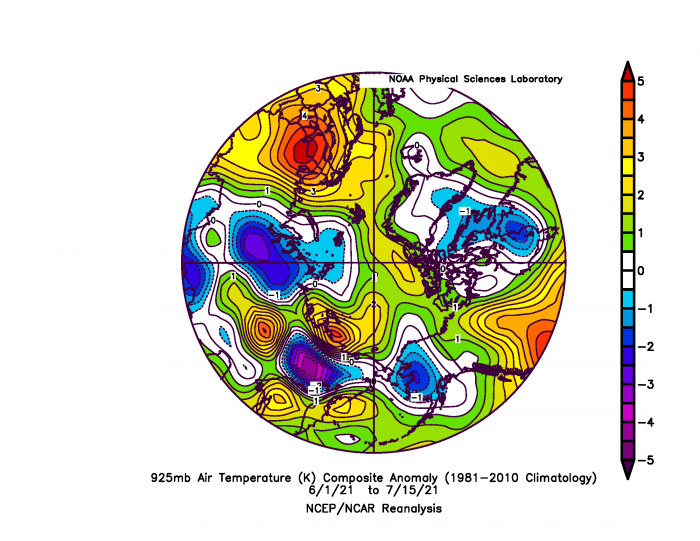
Note: See NOAA/ESRL web site at: http://psl.noaa.gov.
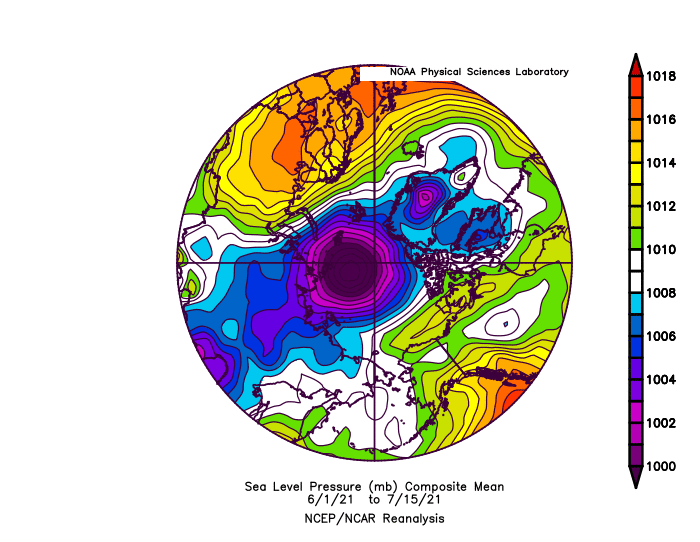
Note: See NOAA/ESRL web site at: http://psl.noaa.gov
Ocean Heat
Sea surface temperatures (SSTs) in most of the Arctic seas are not particularly anomalous in late July 2021, relative to a 1981–2010 climatology (Figure 8). High SSTs in the western Kara and southern Barents are an exception, although anomalous values of ~3℃ were also observed in these areas in recent years. The same is true for the continental shelf off the Mackenzie River delta, where the ocean warms via solar radiation inputs and river heat that originates in the Great Slave Lake. A very interesting situation exists in the Laptev Sea and western East Siberian Sea, which experienced relatively early ice retreat (See Current Conditions discussion section) and warm air surface temperature anomalies (Figure 6), but where SSTs are not particularly anomalous (Figure 8). In most cases, early ice retreat is associated with high SSTs because the sun warms the ocean (or warm ocean currents move in from the south). In this case, however, the relationship is not strong, suggesting that something is preventing solar radiation from warming the ocean surface. The most likely candidates are anomalous cloud cover and/or possibly wildfire smoke.
Predictions from Spatial Fields: Sea-Ice Probability, Ice-Free Date, and Initial Conditions
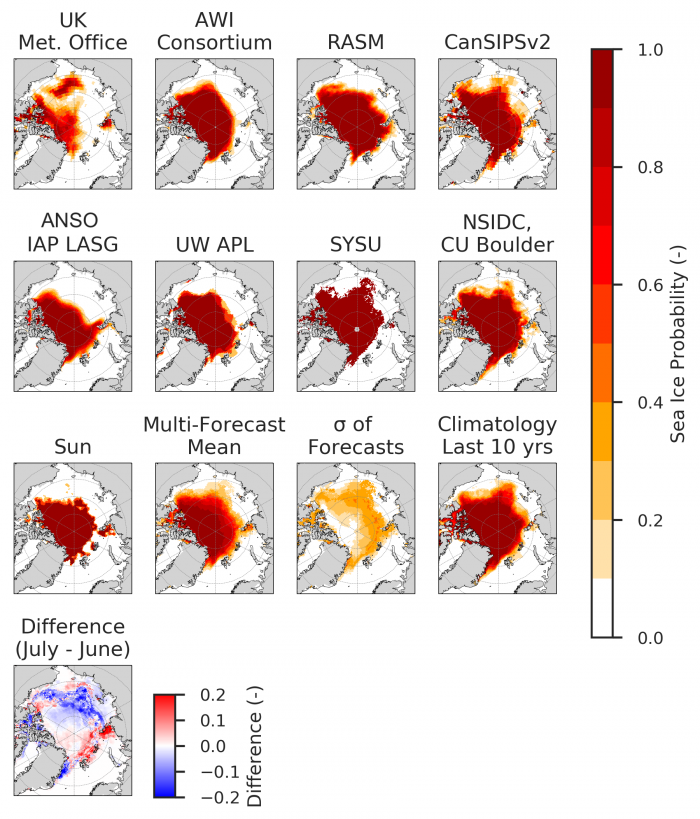
We invited outlooks for September sea-ice probability (SIP) and first ice-free date (IFD). Additionally, SIPN2 is computing SIP and IFD from forecasts of sea-ice concentration (SIC) submitted directly by contributors, and we encourage all groups to submit full-field SIC forecasts whenever possible. We do not bias-correct any fields.
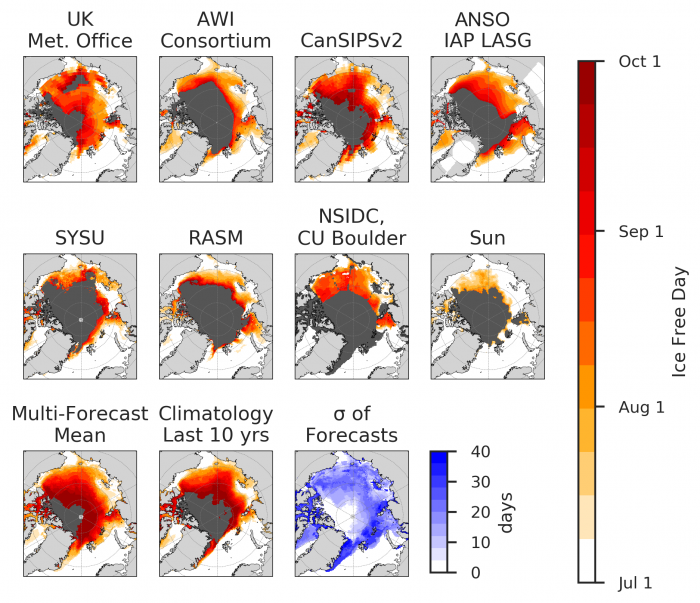
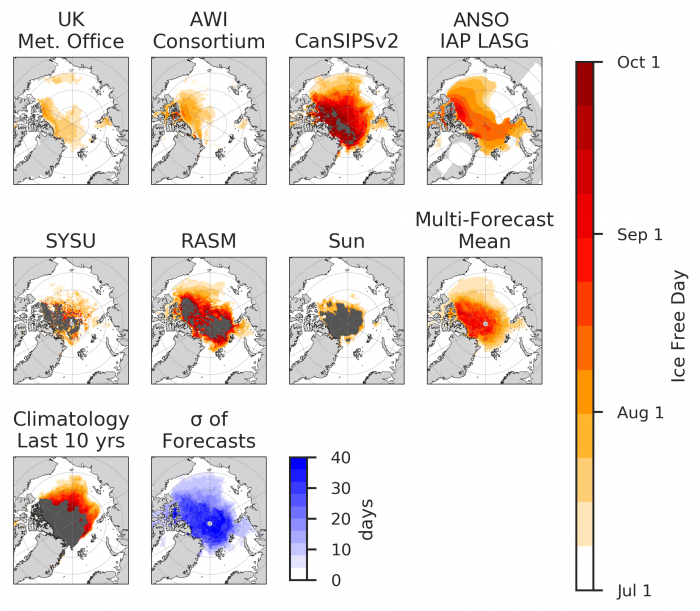
SIP is defined as the fraction of ensemble forecasts that forecast September ice concentration in excess of 15% (for example, if just four out of eight ensemble forecasts predict in excess of 15% sea ice, the SIP is 50%). IFD is the first date in the melt season at which the ice concentration at a given location first drops below a certain threshold—we show forecasts of IFDs for two thresholds: 15% and 80% sea-ice concentration. We show nine forecasts of SIP (six Dynamical, three Statistical) and eight forecasts of IFD (five Dynamical, three Statistical).
Sea-Ice Probability (SIP)
Similar to the June 2021 SIO, forecasts of SIP generally agree in low September SIPs compared to past years' forecasts. July SIP forecasts are lower compared to the June 2021 forecasts across much of the Arctic from the Beaufort to the Laptev seas. In June, all forecasts show an open Northeast Passage, however, in July the passage is no longer forecast to be open, with general agreement among July forecasts for increased SIP north of the Taymyr Peninsula (74N, 98E; Figure 9). The forecast uncertainty is larger in the July forecasts compared to those from June 2021.
First Ice-Free Date (IFD)
Figure 10 and Figure 11 show forecasts of ice-free dates using the 15% and 80% sea-ice concentration thresholds. The observed Laptev Sea was ice-free by the last week of June 2021 and was well forecasted by several models from the June 2021 SIO. Most of the July 2021 forecasts show predominantly ice-free areas in the Laptev Sea by early July. The uncertainty is lower east of the Taymyr Peninsula than to the west in the Atlantic sector of the Arctic (Figure 10, 15% SIC). Forecasts for July, like June, diverge in their forecasts of closed pack ice (Figure 11, 80% SIC) in the central Arctic.
Forecast Initial Conditions
Starting in 2020, we invite forecast contributors to submit their forecast initial conditions of sea-ice concentration and sea-ice thickness to better understand how observations are being used in forecasts. For the July 2021 SIO, we have received three submissions of initial conditions, all from dynamical models (APL, CanSIPSv2, RASM, AWI), shown in Figure 12.
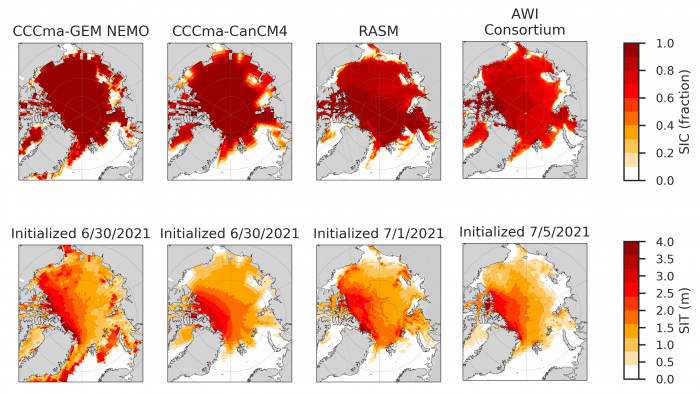
Forecast initial conditions of sea ice concentration generally show good agreement across the different models, with concentrations close to 100% over much of the Arctic Ocean while showing retreat along the Arctic coast. In contrast, forecast initial conditions of sea-ice thickness show less agreement across models. While all models show thick sea ice north of Greenland and the Canadian Arctic Archipelago, similar to the June 2021 SIO, they disagree significantly in the thickness distribution in the Pacific Arctic. Overall, the pattern of better initial conditions agreement of sea-ice concentration compared to sea-ice thickness is consistent with that found in 2020.
Regional Sea-Ice Extent
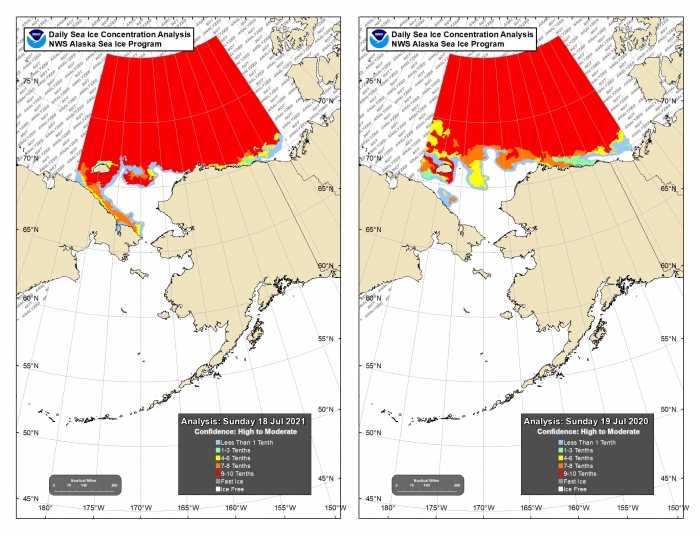
The 2021 Alaska region mid-July sea-ice concentrations are more extensive compared to 2020; in 2021 the sea-ice edge extends farther south and there is a thin strip of sea ice along the Chukotka coast (Figure 13). The Alaska Region is defined as the Bering, Chukchi, and Beaufort seas. The Bering Sea has no sea ice. The combined Chukchi and Beaufort sea-ice extent continues to be slightly lower than the 1981–2010 average (Figure 14) and the retreat is much slower than the 2019 season and follows that of the 2020 season. The 18 July sea-ice extent in the Chukchi Sea was 0.53 million square kilometers, which is lower than the 1981–2010 median of 0.58 million square kilometers. The 18 July sea-ice extent in the Beaufort Sea was 0.85 million square kilometers and is slightly above the 1981–2010 median value (0.81 million square kilometers).

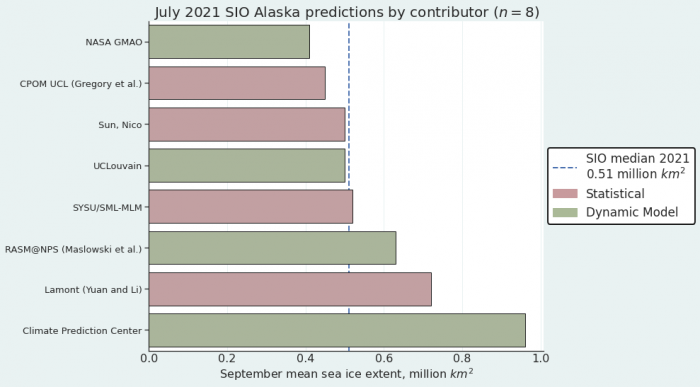
The multimodal median for the July 2021 SIO forecasts is 0.51 million square kilometers down from 0.67 million square kilometers from the June 2021 SIO forecast. The dynamical model projections range from 0.41 to 0.96 million square kilometers with a mean of 0.62 million square kilometers (Figure 15). The statistical model projections range from 0.45 to 0.72 million square kilometers with a mean of 0.55 million square kilometers. The dynamical forecasts display a larger spread (standard deviation of 0.24) compared to the statistical models (standard deviation of 0.12) which is opposite from the June 2021 SIO (Figure 16). To put these forecasts in historical perspective, the September mean sea-ice extent for the Alaska seas (Bering, Chukchi, and Beaufort) averaged over 2007–2020 is 0.44 million square kilometers (See Figure 19 June 2021 SIO), making the forecasts for 2021 above all observed values since 2015.
Arctic Sea-Ice Extent Anomalies
The pan-Arctic sea-ice extent anomaly is the departure of the contributors' September extent Outlook relative to the contributors' baseline trend (e.g., the trend in historical observations, model hindcasts, etc.). The 14 contributions of September mean sea-ice extent anomaly range from -0.23 to +0.79 million square kilometers, with ten forecasts above and four below the contributors' baseline (Figure 17). For historical perspective, the observed anomalies from a linear trend over the 2005–2020 period are shown in Figure 17. The observed anomalies from the trend range from -1.22 (2012) to 0.74 (2006) million square kilometers (See: June 2021 SIO Figure 21 for reference), while the July SIO anomaly forecast has a standard deviation of 0.27 million square kilometers, compared to a June 2021 SIO standard deviation of 0.57 million square kilometers. Most anomaly forecasts decreased in size between June and July, except for the two largest positive anomaly forecasts.
Antarctic Contributions
Eight outlooks were initially submitted in June, and seven were updated for this July call (Figure 18). The spread in July is slightly reduced thanks to the convergence of one dynamical model contribution toward the ensemble mean (Figure 18). Note that the other dynamical submission (UCLouvain) is the one for which no update was provided. However, the spread still exceeds the range in the observed satellite record. This is a remarkable range compared to the Arctic submissions.
As for June outlooks, the bulk of the forecast distribution is concentrated around the climatological and anomaly persistence forecasts. The dynamical forecast that was clustered with the statistical contributions in June (Wu, Tallapragada, and Grumbine) is leaving the center of the distribution, so that the cluster of forecasts at the center of the distribution is only made up of statistical contributions.
Initial findings from the SIPN South project suggest that for the summer season, the forecasts of sea-ice concentration from statistical forecasts are more skillful than from dynamical ones. If the same holds for winter, then we should expect close-to-average conditions in September, continuing the conditions average observed since the beginning of the year (see: NSIDC's Antarctic Sea Ice Extent).
References
Kalnay, E., et al. 1996. The NCEP/NCAR Reanalysis 40-year Project. *Bulletin of the American Meteorological Society 77:437–471.*
doi: 10.1175/1520-0477(1996)077<0437:TNYRP>2.0.CO;2
Tschudi, M., W. N. Meier, and J. S. Stewart. 2019. Quicklook Arctic Weekly EASE-Grid Sea Ice Age, Version 1. [25 June–1 July 2021]. Boulder, Colorado USA. NASA National Snow and Ice Data Center Distributed Active Archive Center. doi: https://doi.org/10.5067/2XXGZY3DUGNQ. [Accessed 7 July 2021].
Contributor Key Statements
![]() 2021 SIO July Contributor Key Statements (70.47 KB)
2021 SIO July Contributor Key Statements (70.47 KB)
Contributor Full Report PDFs and Supplemental Materials
| Attachment | Size |
|---|---|
| 2021 SIO July Contributor Key Statements70.47 KB | 70.47 KB |
This report was developed by the SIPN2 Leadership Team
Report Leads
Mark Serreze, NSIDC Director, University of Colorado Boulder, NSIDC
Walt Meier National Snow and Ice Data Center
Additional Contributors:
Richard Thoman, Alaska Center for Climate Assessment and Policy, International Arctic Research Center, University of Alaska
Matthew Fisher, Cooperative Institute for Research in Environmental Sciences at the University of Colorado Boulder, NSIDC
Editors:
Betsy Turner-Bogren, ARCUS
Helen Wiggins, ARCUS
Lisa Sheffield Guy, ARCUS
Kuba Grzeda, ARCUS
Suggested Citation:
Serreze, M. and W. Meier, U.S. Bhatt, P. Bieniek, E. Blanchard-Wrigglesworth, H. Eicken, M. Fisher, L. C. Hamilton, J. Little, F. Massonnet, J.E. Overland, M. Steele, J. Stroeve, R. Thoman, J. Walsh, M. Wang, and H. V. Wiggins. Editors: Turner-Bogren, B., L., Sheffield Guy, J.K. Grzeda, and H. V. Wiggins. July 2021. "Sea Ice Outlook: 2021 July Report." Published online at: https://www.arcus.org/sipn/sea-ice-outlook/2021/july
This Sea Ice Outlook Report is a product of the Sea Ice Prediction Network–Phase 2 (SIPN2), which is supported in part by the National Science Foundation under Grant No. OPP-1748308. Any opinions, findings, and conclusions or recommendations expressed in this material are those of the author(s) and do not necessarily reflect the views of the National Science Foundation.
