
Outlook Report
Executive Summary
Thank you to the groups that contributed to this 2019 August Sea Ice Outlook (SIO) report. This activity would not be possible without the dedication of so many people who contributed to the 2019 and previous SIOs that include Pan-Arctic, Antarctic, and regional forecasts. The 2019 August Sea Ice Outlook received a record number of 42 submissions (31 in June, 39 in July). These outlook contributions are based on a variety of methods, including dynamical (physics-based) models, statistical approaches, heuristic (qualitative), and a forecast based on Artificial Intelligence. Along with projections of total Arctic sea-ice extent for September, the SIO received seven (6 in June, 9 in July) projections of Antarctic total ice extent and 11 (9 in June, 10 in July) projections of ice extent in the Alaskan sector, which combines the Bering, Chukchi, and Beaufort seas.
The Pan-Arctic August Outlook is based on a total of 42 forecasts with a median value for September 2019 sea-ice extent of 4.22 million square kilometers and with quartile values of 4.0 and 4.4 million square kilometers. The median outlook is slightly lower than the outlooks issued in July (4.28 million square kilometers) and June (4.40 million square kilometers) and the decrease from the July median is due primarily to the dynamical model forecasts. From mid-June through mid-August, pan-Arctic sea-ice extent was tracking very close to the record minimum of 2012 and fell below 4.9 million square kilometers on August 19. Since the rate of melt has slowed down in late August, a record minimum extent is not expected, unless late summer storm activity consolidates ice extent.
We received seven forecasts for Antarctic total September sea-ice extent and they continue to display a large spread. Two persistence-based forecasts suggest that a record low in September is a distinct possibility for Antarctic sea ice extent.
For the Alaskan regional sea-ice extent a median value of 0.37 million square kilometers was predicted from the 10 contributions received: 4 were based on statistical methods and 6 were based on dynamical models. Ice extent in the Chukchi and Beaufort seas continued to decline in early August largely tracking the trend of 2012. However, the rate of melt has slowed since mid-August so it may not reach a record in the Alaska region. Late August sea ice extent observations in the Alaskan Seas are 0.43 million square kilometers.
The 2019 SIO reports are the product of the Sea Ice Prediction Network - Phase 2 SIPN2 effort. The goal of the previous SIPN1 was to enhance scientific discussion on the physics that control summer sea-ice extent. SIPN2 goes deeper into quantitative comparisons of model forecast output. For the second year, all participants whose methods provided information at the local scale were encouraged to provide full spatial fields via the SIPN Data Portal for computation of metrics such as sea-ice probability (SIP) and first ice-free date (IFD), as well as additional regional analyses.
Note: The Sea Ice Outlook provides an open process for those interested in Arctic sea ice to share predictions and ideas; the Outlook is not an operational forecast.
Overview
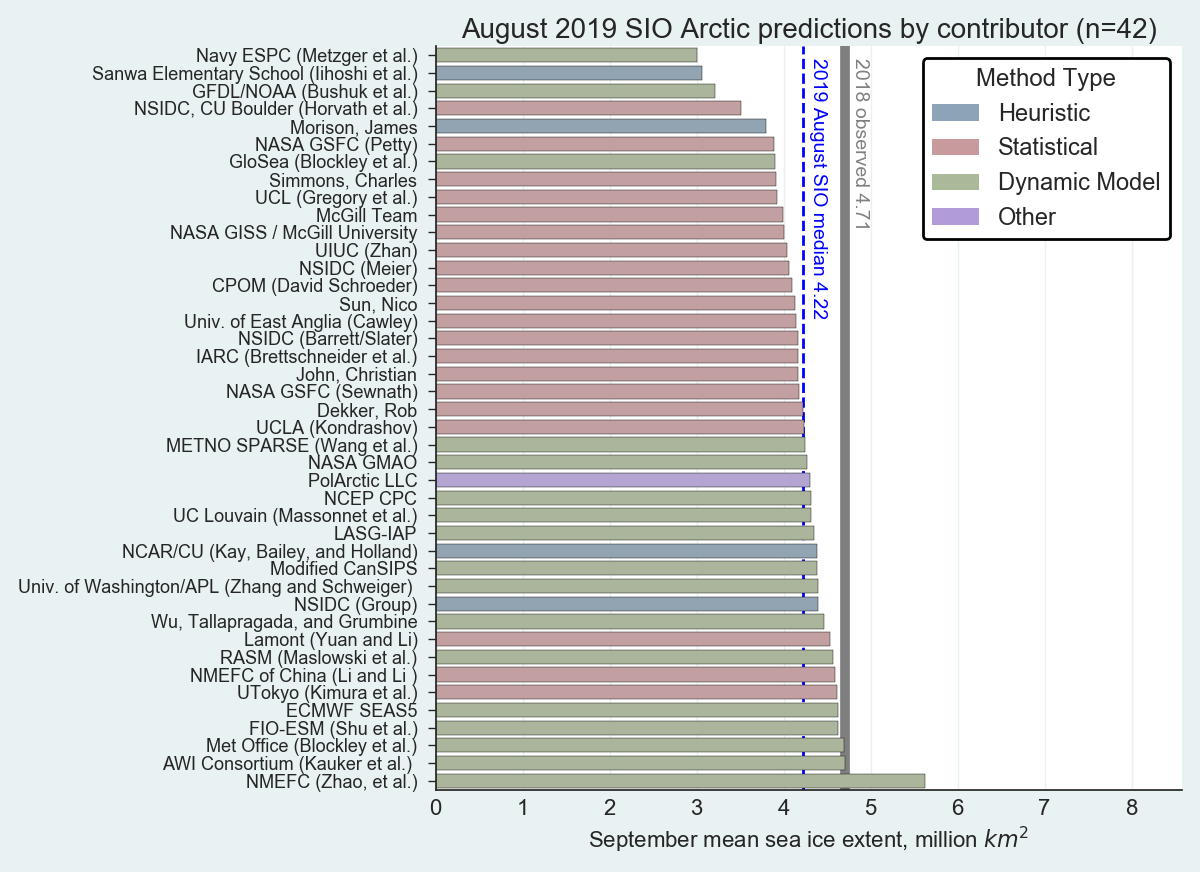
The August Outlook is based on a total of 42 forecasts (Figure 1), of which 26 are August submissions while the remaining 16 are reused submissions from June and July. The median August Outlook value for a September 2019 sea-ice extent is 4.22 million square kilometers with quartile values of 4.0 and 4.4 million square kilometers. Of the 42 August 2019 contributions, 17 are based on dynamical models, 20 are based on statistical methods, four are based on heuristic approaches (qualitative analyses), and one used artificial intelligence. The median outlook is slightly lower than the outlooks issued in July (4.28 million square kilometers) and June (4.40 million square kilometers). The decrease from the July median is due primarily to the dynamical model forecasts, for which the median forecast decreased from 4.6 million to 4.4 square kilometers. The coupled dynamical models continue to forecast slightly higher values (4.5 million square kilometers) than the other dynamical models (ice-ocean or unspecified). The median values of the July forecasts from the statistical method is approximately 4.1 million square kilometers, while the median of the heuristic forecasts is also about 4.1 million square kilometers.
Of the three approaches, the heuristic forecasts have the largest quartile ranges (3.6 to 4.4 million square kilometers). The corresponding ranges are 4.3 to 4.6 million square kilometers for the dynamical model forecasts and 4.0 to 4.2 million square kilometers for the statistical forecasts. As shown in Figure 2, the quartile ranges of the statistical and dynamical model forecasts issued in August are substantially smaller than the corresponding ranges of the July forecasts, pointing to a reduction of the uncertainties within each source. However, the quartile ranges of the statistical and dynamical model forecasts display no overlap in August.

Download High Resolution Figure 1

Predictions from Spatial Fields (SIP and IFD)
Sea-ice probability (SIP) is defined as the fraction of ensemble members in an ensemble forecast with September ice concentration in excess of 15%. First ice-free date (IFD) is the first date in the melt season at which the ice concentration at a given location first drops below 50% and stays below 50% for the following 10 days.
For the August SIO, we received 12 submissions of SIP (9 dynamical, 3 statistical) and 7 submissions of IFD (6 dynamical, 1 statistical). We typically have fewer estimates of IFD because daily Sea Ice Concentration (SIC) forecasts are needed, yet some participants only provide monthly SIC forecasts. We show SIP forecasts in Figure 3 and IFD forecasts in Figure 4.
The patterns of SIP forecasts are similar to those for July, but with lower values around the marginal ice zone, especially in the Pacific side of the Arctic Basin, with many models forecasting a more poleward sea-ice edge with respect to their July and June forecasts, in line with forecasts of lower sea-ice extent as shown in Figure 2. The Northeast Passage is forecast to remain open (as it is currently). Once again, model uncertainty is especially marked in the Beaufort/Chukchi/East Siberian seas, whereas most contributors (with the exception of NOAA GFDL) forecast the sea ice hugging the coast north of Svalbard and Franz Josef archipelagos. Interestingly, the multi-forecast mean SIP is similar to the spatial pattern, though generally poleward of a climatology forecast that uses the last 10 years of September sea-ice cover as predictors.
 for the August SIO from nine dynamical models and three statistical models, plus the mean and standard deviation across all SIP forecasts. The climatology of the last 10 years is a benchmark estimate purely from observations. The final panel is the difference of the multi-forecast means from August and July. Figure courtesy of Cecilia Bitz and Ed Blanchard-Wrigglesworth, University of Washington.")
 in 2019 for the August SIO. We also show the multi-forecast mean, the climatology over the last 10 years, and the standard deviation across individual forecasts (which quantifies where forecast uncertainty is greatest). Dark grey indicates regions that never become ice-free by our criteria. Figure courtesy of Cecilia Bitz and Ed Blanchard-Wrigglesworth, University of Washington.")
Forecasts of IFD show significant model uncertainty in melt dates, even in forecasts initialized this late in the melt season. Some models show melting conditions along the marginal ice zone well into September (e.g., Navy ESPC, Modified CanSIPS), whereas others end the melt season a month earlier, with latest ice-free days in late August (e.g., NOAA GFDL, MetOffice). This is an indication of how forecasts have difficulty identifying the September minimum and the timing of ice retreat.
Editor's Note: As of 4 September 2019, revised Figures 3 and 4 include data from LASG-IAP.
Current Conditions
From mid-June through mid-August, pan-Arctic sea-ice extent was tracking very close to the record minimum of 2012 (Figure 5). Pan-Arctic extent fell below 4.9 million square kilometers on 19 August. As shown in Figure 6, ice coverage was far below the historical (1981—2010) mean over most longitudinal sectors of the Arctic Ocean. The ice edge was several hundred kilometers north of its historical mean location over the entire region north of Alaska and Russia. Only the far eastern Beaufort Sea and the region from the northeastern Greenland coast to east of Svalbard were close to the historical median.

. The orange line shows the 1981 to 2010 average extent for that day. Graphic provided by the National Snow and Ice Data Center.")
The current distribution of sea ice corresponds well with the departures from normal air pressure and temperature observed thus far during the summer. The first half of July featured significantly more southerly winds across the northern Bering and Chukchi seas, which promoted continued ice loss, with every day during the month being the lowest sea-ice extent of record for the basin in the 41-year NSIDC Sea Ice Index version 3. During the second half of July a similar increase in south winds promoted ice loss in the East Siberian Sea.
For the longer melt period from mid-June to mid-August, temperatures in the northern coastal regions of Alaska and most of Russia were above normal, while cooler-than-normal conditions have prevailed in northwestern Canada (extending to southern Banks Island) and in far western Russia, including the Barents Sea. Sea level pressure and wind anomalies have been generally weak in the Pacific sector of the Arctic Ocean, but the Atlantic sector has been dominated by positive pressure (Figure 7) and geopotential height anomalies over Greenland. The associated pressure gradient north and east of Greenland has served to advect ice into the Atlantic sector of the Arctic, resulting in the near-median location of the ice edge from the eastern Greenland coast to the waters immediately east of Svalbard.

Note: NCEP/NCAR Reanalysis information is available here and NOAA/ESRL Physical Sciences Division products are found here.
For the remainder of August, the Climate Prediction Center's Global Ensemble Forecast System predicts cooler than normal conditions over the Beaufort Sea and northeastern Alaska, largely as a result of low-pressure systems over northwestern Canada and the Beaufort Sea. While these storms will maintain cool conditions in the North American Arctic, their dynamical impacts may contribute to further loss of sea ice in the region. However, for the month of September, temperatures are forecast by the North American Multi-Model Ensemble (NMME) to be warmer than normal by 0.5 to 1.5°C over nearly the entire Arctic Ocean. The largest warm departures are forecast for the Chukchi and Beaufort seas. The NMME is a collection of about six models, all of which are coupled atmosphere-ocean-ice models and all of which were initialized based on observed conditions including the sea ice state. For this reason, the recent runs of these models have large areas of open water corresponding to recent conditions, so the forecast positive temperature departures in the Arctic likely result in part from the reduced sea-ice cover that has prevailed through the present summer.
Ocean Heat
As sea ice has retreated at a pace comparable to the record sea ice minimum year of 2012, sea surface temperature (SST) has warmed, forced locally by atmospheric surface heating and by warm ocean currents from the south. However, the timing of ice retreat has a large impact on SST increase during the summer. For this year, some areas (e.g., the Bering and Chukchi seas) were open quite early in the retreat season, and thus have warmed substantially. Other areas (e.g., the eastern Beaufort and East Siberian seas) have only recently opened up, and are thus relatively cool at this time. This situation is not unlike the late opening that occurred in 2012, which led to large areas of open water at northern latitudes that were by the end of summer not dramatically above the freezing point. A particularly interesting area is the eastern Beaufort Sea, which had a relatively large area of warming open water in June, but then closed up again through late July. The ice has again retreated northward in August, but now it is "too late" for the waning atmospheric surface heat fluxes to increase SSTs very much. Thus, SSTs are generally cooler in the eastern Beaufort relative to the western Beaufort, which is exactly opposite to the usual situation.
 and ice concentration (NSIDC NRT passive microwave) for Sunday, 11 August 2019. The locations of two UpTempO drifting buoys are marked as 1 (top left in map) and 7 (center-left in map). Image sourced from NOAA dOISST, NSIDC Near-Real-Time (NRT) passive microwave, and UpTempO data.")
Note: Figure 8 sources are found at: NOAA dOISST and NSIDC Near-Real-Time (NRT) passive microwave. Data for UpTempO drifting buoys locations is available for downloading here.
Regional Sea-Ice Extent Discussions
Alaska Region
Until mid-August, the combined sea-ice extent for the Chukchi and Beaufort Seas continued to be lower than in any previous year of the satellite record (Figure 9) and after mid-month the sea- ice extent decrease has slowed. Sea-ice extent in the Chukchi decreased by 264,702 square kilometers between 17 July and 20 August, remaining lower than past retreat seasons. The retreat has slowed down since mid-August and if this trend continues it will not be lower than 2012 or 2018. In the Beaufort, previously stalled retreat sped up since mid-July, losing 327,250 square kilometers of sea ice, but remains above the 20 August 2012 sea-ice extent. The MASIE-based product now has five seasons (2015—2019) and the Chukchi sea ice extent over the past four weeks is the lowest of the record. The Beaufort sea-ice extent from MASIE continues to track close to the previous low in 2016 from mid-July to mid-August 2019. The MASIE product is considered more reliable during the melt season because it is a multi-sensor product that includes the use of visible imagery and manual interpretation.
, 2018 (red), 2019 (green), and 1981–2010 median (black) (left). Sea-ice concentration for the Bering, Chukchi, and Beaufort seas up to 20 August 2019.")

For the Alaska region sea-ice extent minima prediction, four of the ten contributions we received are based on statistical methods, and six are based on dynamical models (Figure 10) and the median value of all forecasts is 0.37 million square kilometers. August forecasts range from 0.03 million square kilometers to 0.61 million square kilometers. The forecast spread in August increased from the July forecast with the statistical models located in the middle of the ranked forecasts. The observed trajectory for 2019 (Figure 9) suggests that the minimum in the Alaska region may be below 2018 (0.48 million square kilometers) values but will not break the 2012 record (0.100 million square kilometers).
Hudson Bay
While passive microwave sea-ice concentrations from SSMI provided by NSIDC, as well as those from AMSR2 provided by University of Bremen, suggest Hudson Bay is now ice-free, as of 21 August, a small amount of sea-ice remains within the southern part of Hudson Bay according to ice charts (Figure 11) and the MASIE product (Figure 12). This ice is of very low sea ice concentration, between 10 and 40% (or even less) and according to the MASIE product represents 9,300 square kilometers of ice. Only two of the six regional forecasts of sea ice conditions within Hudson Bay retain some ice, ranging from as high as 810,000 square kilometers to 2,940 square kilometers of ice. Given the low sea-ice concentrations of the remaining ice within Hudson Bay. It is still likely that it will all disappear by the end of the summer melt period.
 sea ice analyses for Hudson Bay on 21 August. The ice charts are produced based on manual analysis and integration of multiple satellite imagery. Light green areas (labeled B and C) are 10—30% concentration; the yellow area (labeled A) is 40—60% concentration.")
 product generated by the U.S. National Ice Center and distributed by the National Snow and Ice Data Center (NSIDC), MASIE maps extent of ice above 40% concentration. MASIE is produced by manual analysis of multiple satellite imagery; it is produced independently of the NIC ice charts, though much common imagery is used as a source for both products.")
Note: The MASIE product from the National Ice Center and National Snow and Ice Data Center is compiled by F. Fetterer, M. Savoie, S. Helfrich, and P. Clemente-Colón. 2010, updated daily. Multisensor Analyzed Sea Ice Extent - Northern Hemisphere (MASIE-NH), Version 1. Boulder, Colorado USA. NSIDC: National Snow and Ice Data Center. doi: https://doi.org/10.7265/N5GT5K3K.
Antarctic Contributions
For this August report, we received seven forecasts of total September Antarctic sea-ice extent (two are re-submissions from the July report). There is still a very large spread in the forecasts (Figure 13) despite the target date being only two months ahead. The spread is only modestly reduced from June to August. That is, new information acquired in June and July does not substantially make the forecasts more certain in August. The two persistence-based forecasts used as benchmarks indicate that a record low in September is a distinct possibility. At the time of writing these lines, 2019 is below climatology in terms of sea-ice extent but not below the two lowest years on record, 1986 and 2017.
As was the case for previous years, the Sea Ice Prediction Network South will extend these analyses by coordinating a forecast for austral summer 2019—2020 and investigating the regional expression of forecast biases and uncertainties.
 from 1979—2018, the June-July-August 2019 forecasts for September 2019 (colored crosses), and two benchmark forecasts: 1979—2018 mean September sea-ice extent (black square) and the May (for June), June (for July) and July (for August) 2019 anomaly relative to 1979—2018 added to the September 1979—2018 mean (black stars). Note: The August NASA GSFC (Petty) forecast is close to climatology.")
Contributor Submission Materials
Contributor Key Statements with Summaries of Uncertainties
This report was developed by the SIPN2 Leadership Team
Report Leads
Uma Bhatt, University of Alaska Fairbanks, Geophysical Institute
John Walsh, International Arctic Research Center, University of Alaska Fairbanks
Additional Contributors:
Rick Thoman, Alaska Center for Climate Assessment and Policy, International Arctic Research Center, University of Alaska
Molly Hardman, Cooperative Institute for Research in Environmental Sciences at the University of Colorado Boulder, NSIDC
Editors:
Betsy Turner-Bogren, ARCUS
Helen Wiggins, ARCUS
Stacey Stoudt, ARCUS
Lisa Sheffield Guy, ARCUS
Suggested Citation:
Bhatt, U.S. and Walsh, J., P. Bieniek, E. Blanchard-Wrigglesworth, H. Eicken, M. Hardman, L. C. Hamilton, J. Little, F. Massonnet, W. Meier, J.E. Overland, M. Serreze, M Steele, J. Stroeve, R. Thoman, M. Wang, and H. V. Wiggins. Editors: Turner-Bogren, B., L. Sheffield Guy, S. Stoudt, and H. V. Wiggins. August 2019. "Sea Ice Outlook: 2019 August Report." (Published online at: https://www.arcus.org/sipn/sea-ice-outlook/2019/august.)
This Sea Ice Outlook Report is a product of the Sea Ice Prediction Network–Phase 2 (SIPN2), which is supported in part by the National Science Foundation under Grant No. OPP-1748308. Any opinions, findings, and conclusions or recommendations expressed in this material are those of the author(s) and do not necessarily reflect the views of the National Science Foundation.
