Table of Contents
- Section 1. Report Highlights
- Section 2. Introduction/Overview
- Section 3. Review of 2021 SIO Contributions and Sea-Ice Extent Anomalies
- Section 4. 2021 Observed Arctic Conditions During the Sea-Ice Retreat Season
- a. Observed Sea Ice
- b. Ocean Heat Conditions
- c. Atmospheric Conditions
- d. Discussion of 2021 Sea-Ice Advance Season
- Section 5. Review of 2021 Antarctic Contributions and Observed Antarctic Conditions
- Section 6. Discussions of 2021 SIO
- a. Review of Forecast Methods
- b. Evaluation of 2021 SIO Forecast Skill Relative to Control Forecasts
- c. Information on New Data Products for Sea-Ice Forecasting
- Section 7. Sea Ice Drift Forecast Experiment (SIDFEx) Results
- References
- Report Credits
Section 1. Report Highlights
The Sea Ice Outlook (SIO) is a community network activity led by the Sea Ice Prediction Network-Phase 2 (SIPN2) Project Team with contributions from key partners. SIPN2 is a community of scientists and stakeholders with the goal of advancing our understanding of the state and evolution of Arctic sea-ice cover.
- The observed September monthly averaged sea-ice extent was 4.92 million square kilometers based on data from the National Snow and Ice Data Center (NSIDC) Sea Ice Index (SII).
- In 2021, new additions to the SIO include early September initialized forecasts and anomaly forecasts for September mean Arctic sea-ice extent.
- A total of 160 pan-Arctic September extent forecast submissions in June, July, August, and September were received during the 2021 SIO season.
- The August and September medians of SIO contributions of 4.39 million square kilometers were closest of all forecast months but were still well below the observed September extent of 4.92 million square kilometers.
- For the combined Bering, Chukchi, and Beaufort seas, or Alaska Region, the SIO median forecast for June through September was 0.67, 0.51, 0.62, and 0.50 million square kilometers, well below the 2021 observed value of 0.81 million square kilometers.
- The 2021 Antarctic sea-ice extent reached 18.45 million square kilometers in September, which is the 21st highest out of 43 years and 0.04 million square kilometers below climatology.
- The SIO partner activity, Sea Ice Drift Forecast Experiment (SIDFEx), received forecasts for September buoy locations in the Arctic submitted by five of the 2021 SIO contributors. The buoy locations were contained in the 90% confidence forecast ellipses, on average, 52% of the time, indicating that errors are not fully captured by ensemble spread.
This 2021 Post-Season Sea Ice Outlook Report was developed by lead author Uma Bhatt, University of Alaska Fairbanks, Geophysical Institute (Report Highlights, Overview, and Review of 2021 SIO Pan-Arctic and Regional Contributions, including Sea-Ice Extent Anomalies); Walt Meier, NSIDC (discussion of Arctic sea-ice conditions and Information on New Data Products for Sea-Ice Forecasting); Michael Steele, University of Washington (discussion of Ocean Heat Conditions); Mark Serreze, NSIDC and James Overland, NOAA (discussion of Atmospheric Conditions); François Massonnet, Université Catholique de Louvain (Review of 2021 Antarctic Contributions and Observed Antarctic Conditions); Ed Blanchard-Wrigglesworth, University of Washington (discussion of 2021 fall ice advance and review of dynamical forecast methods); Muyin Wang, University of Washington (review of statistical forecast methods); John Walsh, International Arctic Research Center and Larry Hamilton, University of New Hampshire (Evaluation of 2021 SIO Forecast Skill Relative to Control Forecasts); Julienne Stroeve, NSIDC (Information on New Data Products for Sea-Ice Forecasting) Helge Goessling and Valentin Ludwig, Alfred-Wegener Institute (discussion of SIDFEx results), Matthew Fisher, NSIDC (statistics and graphs); and Betsy Turner-Bogren, Lisa Sheffield Guy, and Helen Wiggins, ARCUS (report coordination and editing); and the rest of the SIPN2 Project Team.
Section 2. Introduction/Overview
The Sea Ice Prediction Network–Phase 2 (SIPN2) is a community of scientists and stakeholders with the goal of advancing our understanding of the state and evolution of the Arctic sea-ice cover. The SIO is a community network activity led by the SIPN2 project team with contributions from key partners and the community. This Sea Ice Outlook (SIO) Post-Season Report provides in-depth analysis of factors impacting pan-Arctic September minimum sea-ice extent this past summer, reviews of the 2021 SIOs, and discussions of the additional topics listed in the table of contents.
We are grateful for the excellent participation by contributors to the 2021 SIO to sustain this activity. This year we received a total of 160 submissions of pan-Arctic September extent forecasts. Based on contributor input, this year we solicited two new quantities, i.e., (i) anomaly forecasts and (ii) forecasts initialized in early September, both of which provided insights into our ability to forecast seasonal sea ice. Analysis was facilitated by the SIPN Data Portal that continuously collects forecasts, expanding the forecasts to other seasons beyond the September minimum. For SIO forecasts for the "Alaskan Region" (extent in the combined Bering, Chukchi, and Beaufort seas), we received a total of 31 contributions for the 2021 season.
Section 3. Review of 2021 SIO Contributions and Sea-Ice Extent Anomalies
a. Pan-Arctic
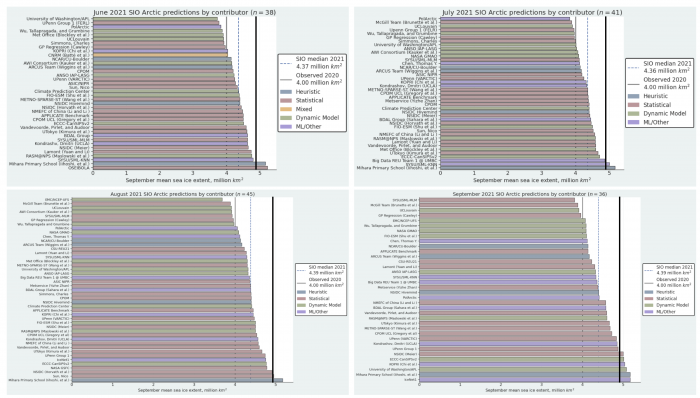
The June, July, August, and September medians of the SIO contributions were 4.37, 4.36, 4.39, and 4.39 million square kilometers, respectively (Figure 1). The small variation between monthly median Outlooks in 2021 was also true for the 2020 SIO. The majority of contributions for all months were lower than the observed Sea Ice Index of 4.92 million square kilometers (Black line in Figure 1), resulting in a median forecast that was also lower than observed for all forecast months. In contrast, the median forecasts were above the observed September mean sea-ice extent in 2020.
The interquartile range (IQR) for the machine learning/Other (ML/Other), statistical, and dynamical models (Figure 2) generally decreased from June to August and then increased from August to September. Medians by method for all months of the 2021 SIO are 4.29, 4.40, 4.2, 4.4, and 4.04 million square kilometers for heuristic, statistical, dynamical, ML/other, and mixed, respectively. The statistical and machine learning methods provided forecasts that were closest to the observed September mean sea-ice extent, yet the observed value remained outside of the interquartile range (IQR).
The pan-Arctic sea-ice extent anomaly is the departure of the contributors' September extent Outlook relative to the contributors' baseline trend. While this definition adds uncertainty, it was chosen to let the broadest group of contributors participate in the 2021 anomaly forecasts. A comparison of anomaly forecasts was motivated by the large spread in SIO contributions, which was hypothesized to be dominated by differences in model sea-ice extent biases. There were 14 (June and July), 15 (August), and 12 (September) contributions. The SIO anomaly forecast had median values of 0.2, 0.11, 0.26, and 0.39 million square kilometers in June, July, August, and September, respectively (Figure 3). The September SIO anomaly forecast had a standard deviation of 0.38 million square kilometers, which can be contrasted with small spreads in earlier forecasts for the 2021 SIO reports (i.e., the standard deviation in August was 0.25, July was 0.27, and June was 0.29 million square kilometers). The mean of the anomaly forecasts increased with each forecast of the summer 2021 SIO season (June = +0.15, July = +0.21, August = +0.26, and September = +0.39). The September interquartile range contained the observed September mean sea-ice extent anomaly of 0.61 million square kilometers (Figure 3). Based on just one season, we conclude that the anomaly forecast spread is still quite large and thus merits further consideration.
 line, September 2020 observed extent from the NSIDC Sea Ice Index (gray line), and September 2021 (4.92 million square kilometers) observed extent from Sea Ice Index (black line).")
Note: Details for Figures 1, 2, and 4 can be found in the monthly reports: Sea Ice Outlook: 2021 June Report, Sea Ice Outlook: 2021 July Report, Sea Ice Outlook: 2021 August Report, and Sea Ice Outlook: 2021 September Report.

Editor's Note: Click on images to enlarge.
 is shown by the gray dashed line and was calculated based on the linear trend of observed September mean sea-ice extent over the 2005–2020 period. Figure courtesy of Uma Bhatt, University of Alaska Fairbanks.")
b. Alaska
This year we again invited participants to submit forecasts of sea-ice extent for the Alaskan region, defined as the combination of the Bering, Chukchi, and Beaufort seas. We received 7 forecasts in June, 8 in July, 9 in August, and 7 in September. Among these, 17 forecast inputs were based on statistical or machine learning methods, and another 14 were based on dynamical models. For the Alaska region, the SIO median forecast for June through September was 0.67, 0.51, 0.62, and 0.50 million square kilometers, respectively, far below the observed sea-ice extent (Figure 4). The median forecast varied over the forecast period and all were well below the observed September mean sea-ice extent of 0.81 million square kilometers. The observed 2021 value does not cross any of the monthly forecast interquartile ranges when grouped by methodology (Figure 5) and the forecast median for all 2021 contributions was 0.62 million square kilometers.
 line, September 2020 observed extent from Sea Ice Index (gray line), and September 2021 (0.81 million square kilometers) observed extent from Sea Ice Index (black line). Panel figures courtesy of Matthew Fisher, NSIDC.")

Section 4. 2021 Observed Arctic Conditions During the Sea-Ice Retreat Season
a. Observed Sea Ice
Sea-ice conditions during 2021 were less extreme than in recent years. The September extent, based on NSIDC Sea Ice Index (Fetterer et al. 2017) data, was 4.92 million square kilometers, 12th lowest in the 43-year satellite record (starting in 1979), but the highest since 2014 (Figure 6). Nonetheless, 2021 continued to be far below levels during the 1980s and 1990s. The last 15 years (2007–2021) have had the 15 lowest September extents in the record.
 and linear fit trend line (blue). Figure from NSIDC Sea Ice Index (Fetterer et al. 2021).")
The spatial distribution of the September sea ice (Figure 7) shows lower than average extent around most of the Arctic, except in the eastern Beaufort Sea where the ice extent was average.
.")
The beginning of the 2021 season was marked by substantial advection of ice into the Beaufort Sea from the north, with convergence near the north Alaskan coast. This led to slower ice loss in the region compared to recent years and the thicker, older ice appears to have prevented complete loss of ice in the Beaufort and Chukchi seas, resulting in higher than average extent in the eastern Beaufort (Figure 8). The relatively higher extent in the Beaufort and Chukchi region was a significant factor in the overall higher September extent compared to the last several years.
However, while older ice in the region did slow some ice loss, overall, multiyear ice ended the summer melt season at a record low level. Based on Tschudi et al. (2019a,b), at the summer minimum extent, multi-year ice covered only 1.29 million square kilometers, effectively tied with the record low in 2012. The minimum extent of the oldest ice (>4 years old) has been <500,000 square kilometers since 2012.
 1985 and (b) 2021. Panel (c) is the timeseries for 1984–2021 of the extent of multi-year (survived at least one summer melt season) ice (black) and ice >4 years old (red) within the "Arctic Ocean Domain" (purple region in inset map). Data from Tschudi et al. (2019a,b); image from the Arctic Report Card 2021 (Meier et al. 2021)")
Conversely, on the Eurasian side of the Arctic, an extremely early melt onset (>30 days earlier than average) in the Laptev Sea (Figure 9) led to early retreat of ice and record low extent in the Laptev Sea during June and early July. The rapid Laptev ice loss led to record low total Arctic extent during the June and July period. However, ice loss rates moderated after and the extent decline slowed, perhaps due to cloudier conditions from overall weak low pressure (see Atmospheric Conditions).
.")
Note: Data for Figure 9 is from NSIDC Arctic Sea Ice News and Analysis. Data from J. Miller (NASA Goddard), updated from Markus et al. (2009) and Stroeve et al. (2014).
b. Ocean Heat Conditions
Figures 10a and b compare conditions in mid-July for 2020 and 2021, illustrating that most areas were substantially cooler in 2021. The pace of ice retreat was similar in both years through early July and, in fact, similar to that in the historical minimum year of 2012 (Figure 10c). Thus, the differences seen in mid-July are very likely a result of the cool, cloudy conditions that persisted through the end of July (discussed in the following section). Atmospheric conditions cleared in August, but this was too late to provide much additional heat to the ocean. The result was a relatively extensive ice cover (with respect to recent years) and cool sea surface temperatures (SSTs).
 from NOAA's OISSTv2.1 data set (Banzon et al. 2020), and ice concentration (gray contours) from NSIDC's near-real-time SSMIS data set (Maslanik and Stroeve 1999) for (a) 12 July 2020 and (b) 12 July 2021. Colored dots indicate drifting UpTempO buoy SSTs. The ovals in (b) indicate areas where open water was cooler in 2021, relative to 2020. (c) Pan-Arctic sea-ice extent from NSIDC's ChArctic web tool, showing summer time series for 2012 (red), 2020 (orange), and 2021 (green). Also shown is the median over 1981–2010 (dark gray line) as well as the interquartile range (median gray shading) and interdecile range (light gray shading).")
As discussed in the previous section, the Beaufort Sea was filled with a mixture of thin, first-year ice and thicker, multi-year ice. This led to a very patchy melt-back pattern that, by the end of summer, included many isolated areas of open water SSTs at or very near freezing (Figure 11). This very quickly froze up in late September and early October. This situation may become more common over the near-term, as a more mobile ice pack brings streams of thick, old ice from near the Canadian Arctic Archipelago into the generally thinner ice of the Beaufort Sea.
 from NOAA's OISSTv2.1 data set (Banzon et al. 2020), and ice concentration (gray contours) from NSIDC's near-real-time SSMIS data set (Maslanik and Stroeve 1999) for 14 September 2021. Colored dots indicate drifting UpTempO buoy SSTs.")
c. Atmospheric Conditions
Past studies have observed that low September sea-ice extent has a tendency to be favored by a summer atmospheric circulation pattern featuring anticyclonic conditions over the central Arctic Ocean, associated with above-average lower-tropospheric temperatures, with higher September sea-ice extent favored by cyclonic conditions and associated cooler conditions. These cooler conditions correspond to the observation that cyclones migrating into the central Arctic Ocean tend to be cold cored. While this must be viewed with the caveat that even modest displacements in the position of mean high and low pressure features can have pronounced effects on both regional and total September ice extent (Serreze et al. 2016), adopting this general framework offers insight into the fairly high (compared to recent years) September 2021 sea-ice extent.
Note from Figure 12 the very flat sea-level pressure (SLP) field over the Arctic Ocean averaged for June through September 2021. The range is only about 4 hPa (or 4 mb); several weak mean low pressure features are embedded in this overall flat field. While there is no evidence of a coherent cyclonic surface wind (and sea ice) circulation, the SLP anomaly field (Figure 13) reveals that this flat pattern was associated with below average pressure (from -1 to -5 hPa), spanning most of the Arctic Ocean. The corresponding summer-averaged temperature pattern reveals positive anomalies at 925 hPa over most of the Arctic Ocean, but these are quite modest; in general, less than 2˚C (Figure 14). It is noteworthy that May 925 hPa air temperature anomalies were 4–6˚C above average over the Laptev Sea and lead to the early sea-ice retreat in this region.
While it is reasonable to conclude that the atmospheric circulation and temperature pattern for summer of 2021 as a whole was not conducive to especially low September sea-ice extent, it is stressed that conditions through the spring, summer, and early autumn were highly variable. As discussed in NSIDC Arctic Sea Ice News and Analysis posts, the slow pace of sea-ice loss in May was associated with a series of low pressure systems migrating over the pole. This stormy pattern persisted through much of June and July, during which there was a prominent area of mean low pressure centered near the pole, resulting in a strongly cyclonic sea-ice motion pattern. There was a mix of positive and negative temperature anomalies over the Arctic Ocean, with an overall predominance of positive anomalies. The pattern then changed, with the first half of August characterized by unusually strong high pressure over Siberia extending towards the pole, coupled with low pressure over the Greenland Ice Sheet, and positive 925 hPa temperature anomalies over the Arctic Ocean. During the first half of September, as the melt season neared its end, the pattern again shifted to high pressure over the central Arctic Ocean, with small Arctic Ocean temperature anomalies.
In summary, while the summer-averaged SLP and SLP anomaly fields manifest the effects of an overall stormy pattern, the highly variable conditions led to an overall flat summer SLP pattern. In turn, variable temperature anomaly patterns averaged out to yield modestly warm summer-averaged conditions. This may simply be an expression of the overall warming Arctic climate, such that the cold-cored cyclones that are characteristic of the Arctic Ocean are not as cold as they once were.
Note: Units of pressure are given in hPa signifying hecto Pascals and is equivalent to mb signifying millibars.
 averaged for June through August of 2021.")


d. Discussion of 2021 Sea-Ice Advance Season
Following September 2021, Arctic sea-ice extent during the fall was the greatest observed during the last five years, despite still being lower than the long-term climatology (Figure 15). However, there were regional contrasts to this pattern. The Chukchi and Barents were characterized by an early freeze-up, thanks in part to a cold November and December, and in mid-November the Chukchi had its greatest sea-ice extent in 20 years (Figure 15) and was close to fully frozen. In contrast, Hudson Bay and the Atlantic-facing Arctic sector (Kara, Barents seas) showed a much later freeze-up than average.

, and on November 15.")
—using 15% and 80% sea-ice concentration (SIC) thresholds—in CanSIPSv2 and RASM and observed 2021 IADs.")
In Figure 16, we show forecasts of ice advance date (IAD) contributed to the August SIO by two models, and the observed 2021 IAD, using two sea-ice concentration thresholds (IADs are defined as the first day when sea-ice concentration reaches 15% and 80%). The Chukchi region had a relatively early IAD this year and this was forecast with some skill by CanSIPSv2 but not RASM. The Laptev, Beaufort, and Kara seas had later IADs (especially considering the 80% threshold), which the forecasts struggled to capture.
Section 5. Review of 2021 Antarctic Contributions and Observed Antarctic Conditions
Total Antarctic sea-ice extent was higher than climatology during March–August 2021, but then returned to close-to-average values in September, being less than 1% below the 1991–2020 average (Figure 17). Nine forecasts were submitted for each month (Figure 18). It appeared in June submissions that forecasts based on statistical approaches would cluster around the climatological forecast while dynamical model contributions would be more spread out. Like previous years, the forecasts based on statistical approaches have a lower bias, but it is important to note that the dynamical predictions are generally not bias-corrected.

Note: Data for Figure 17 is from The Copernicus Programme.

Section 6. Discussions of 2021 SIO
a. Review of Forecast Methods
i. Statistical Methods
This year, 30 groups submitted SIO forecasts based on statistical models. Among them, 8 are self-identified as machine learning models/methods. Among the 30 groups, 23 submitted their SIO forecasts in June, 26 in July, 29 in August, and 23 in September. Seventeen groups submitted Outlooks in 2021 for all four months, 9 groups for three of the months, two groups submitted for two months and two groups submitted for one month. Each individual submission is summarized in Figure 19a. The overall medians for all statistical submissions are 4.48, 4.36, 4.40, and 4.57 million square kilometers for June to September, respectively. The corresponding standard deviations are 0.34, 0.29, 0.27, and 0.37 million square kilometers for each month, respectively. It is apparent from Figure 6a that with the exception of 6 submissions, all other statistical methods under-forecasted the 2021 September mean sea-ice extent.
A few groups (4 to 5 for each month) also submitted outlooks for Antarctic and Alaska regional sea-ice extents.
 for pan-Arctic during 2021 season. Each group of bars is from one individual group as outlined above the plot. Different colors depict the month of submission. The gray horizontal line marks the observed September sea-ice extent, 4.92 million square kilometers. The first eight groups (numbered 1–8) are based on machine learning models.")
ii. Dynamical Methods
For the first time in 2021, the SIO invited contributions for September sea-ice extent (SIE) forecasts in early September. This was partly motivated by asking whether SIO forecasts, which have been known to show very large spread, would converge to a higher skill and narrower forecast distribution as lead times decreased. SIO forecasts in 2021 showed typical levels of skill compared to the full SIO period shown in Figure 1, and only showed modest improvement from June through August (RMSEs of 0.59, 0.58, and 0.52 for June, July, and August SIOs respectively, with little difference across forecast methodologies). September SIO forecasts, requested by 10 September 2021, were slightly more skillful (RMSE for the SIO median of 0.34), yet the forecast spread was still significant (ranging from 3.8 to 5.17 million square kilometers SIE), with several forecasts of September SIE below 4.5 million square kilometers. To further assess these forecasts, we show a simple forecast of September 2021 SIE based on the observed 31 August 2021 SIE and past (1979–2020) daily SIE changes between 31 August and 30 September. These forecasts (shown as cyan-through-red time series, from which we obtain monthly averages in the right panel in Figure 20) show that, by the start of the month, we could expect September SIE values to be in the 4.9–5.4 million square kilometers (interquartile 5.0–5.2) range. In other words, September forecasts below these values would have required record rates of sea-ice loss during September for them to be accurate.
In figure 20, we show the individual unique forecasts (without using repeated forecasts) in 2021 clustered by forecast method.
 SIO forecasts in 2021 clustered by modeling technique. Each dot represents a SIO forecast, while the lines represent the means for each cluster. (right panel) historically constrained forecasts of September 2021 performed on August 31, using the observed sea-ice extent on August 31 2021 and past sea-ice extent tendencies between August 31 and September 30, represented by the cyan-through-red time series (the labeled years indicate the year from which the September tendencies are sampled, note all years 1987–2020 are used). The monthly means of these historically constrained September 2021 sea-ice extent forecasts are shown by the cyan-red cluster and the box and whisker plot, with the observed 2021 value in black. September SIO forecasts are shown in the rightmost column.")
As in 2020, we invited contributors to share their forecasts' sea-ice concentration (SIC) and sea-ice thickness (SIT) initial conditions (ICs). As in 2020, the initial conditions for sea-ice thickness show greater spread, as a percentage of the mean, across forecast models than the initial conditions for sea-ice concentration, reflecting greater observed uncertainty in sea-ice thickness relative to sea-ice concentration. Figure 21 shows total sea-ice volume (in ten trillion cubic meters) in the initial conditions for each model and start date.

Figure 21 shows the spread in sea-ice volume across the forecasts ranges from 15–19.5 trillion cubic meters in June SIO initializations to 4–11.5 trillion cubic meters in August SIO intializations, with a consistency across models (i.e., models that have low initial conditions sea-ice volumes in June tend to have low initial conditions for sea-ice volumes in later forecasts and vice versa). Interestingly, the spread of the initial conditions increased through the summer, perhaps indicating positive albedo feedbacks in the reconstructions of sea ice that are used to provide the initial conditions.
b. Evaluation of 2021 SIO Forecast Skill Relative to Control Forecasts
Key metrics of the skill of the SIO forecasts are the improvement (or reduction of error) relative to control forecasts. A control frequently used in weather and climate forecasting is persistence, which in our application would be a prediction of the same ice extent as the preceding September. Given the strong trend of September ice extent in recent decades, a second control would be a simple extrapolation of the linear multi-year trend. Finally, a third control forecast might use the trend-line anomaly persistence, which is a forecast that the departure from the trend-line will be the same as the preceding September. The following is a summary of the 2021 SIO forecasts relative to these three control forecasts (millions of square kilometers):
")
It is apparent that the SIO median outlook changed little from June through September and was approximately midway between the observed values of 2020 (3.92 million square kilometers) and the 2021 value (4.92 million square kilometers). The median outlooks from all four months out-performed the persistence forecast and the linear trend anomaly persistence forecast by a wide margin. The linear trend anomaly forecast was especially challenged in 2021 because the sign of the anomaly reversed from 2020 to 2021 (from -0.38 to +0.70 million square kilometers). The SIO outlooks also out-performed the simple linear trend extrapolation, although by only a small margin (0.14 vs. 0.17 million square kilometers). Thus, despite the relatively large errors, the 2021 SIO outlooks from all four months out-performed all the benchmarks utilized in SIPN2's previous evaluations of skill relative to simple control forecasts. However, as noted in previous reports, these control forecasts, which performed nearly as well as the SIO forecasts, were available by the end of September 2020, fully eight months earlier than the earliest SIO forecast in June 2021.
The September sea-ice forecasts available from the SIO span 2008–2021, providing a 14-year sample over which SIO skill can be compared with control forecasts based on linear trends or persistence from one year to the next. The table below lists two skill metrics—the root mean squared error (RMS) and median absolute error of observed extent minus predicted extent—over the 14-year period. Persistence refers to guessing that this year's extent will be the same as last year's. Linear trends for extrapolation and anomalies, like SIO, are calculated only from data available prior to the forecasted season. For example, the linear extrapolation for 2021 is based on 1979–2020 data; the linear extrapolation for 2020 is based on 1979–2019 data, and so forth. Linear trend anomaly persistence means adding the error from last year's linear trend extrapolation (a positive or negative number) to the extrapolation for this year. All values are in millions of square kilometers.
 and median absolute error of observed extent minus predicted extent, over the 14-year period.")
Over the 14-year sample, the SIO forecasts outperformed all types of control forecasts, according to both RMS and median absolute error criteria. The improvement is consistent, although modest, ranging from 70,000 to 190,000 square kilometers by the RMS criteria, or from 30,000 to 70,000 square kilometers in terms of median absolute errors.
The 14 years of forecasts are a relatively small sample, so these statistical results continue to shift with the addition of each year. As noted earlier, all the control forecasts are available for the next year as soon as the current year's September ice extent is available. For example, the control forecast for September 2021 based on the linear trend extrapolation is 4.21 million square kilometers.
c. Information on New Data Products for Sea-Ice Forecasting
Recently, two new data products have been developed that may be useful for sea-ice forecasting. One is a daily snow on sea ice product based on a sophisticated snow model forced with atmospheric reanalysis, and implemented using lagrangian ice motion vectors (see Liston et al. 2020 and Stroeve et al. 2020). Fields provided currently include snow depth and ice density, useful for converting satellite altimeter freeboard observations to ice thickness. The use of the new snow depth product has broad implications for sea-ice thickness retrievals, particularly in the marginal ice zone (see Mallett et al. 2021). This dataset is available at 25 kilometers spatial resolution in the EASE-grid from NSIDC Lagrangian Snow Distributions for Sea-Ice Applications, Version 1; Data Set ID: NSIDC-0758 (Liston et al. 2021).
The other dataset is a daily and monthly melt fraction and binary melt vs. no melt estimate from NASA's Moderate Resolution Imaging Spectroradiometer (MODIS) instrument. Melt pond fraction has previously been found to be a good predictor for September sea-ice extent in a modeling study (Schroeder et al. 2014) using a statistical forecasting approach. This new melt pond dataset applies machine learning to estimate melt ponds vs. ice and water surfaces (Lee et al. 2020). The dataset currently spans 1 June 2000 to 31 August 2020, though updates will be done in the next few months to include the 2021 melt season. Data are available at five kilometers spatial resolution in the EASE-grid and can be found via the British Antarctic Service (BAS) Natural Environment Research Council (NERC) Discovery Metadata System Arctic Melt Pond Fraction and Binary Classification, 2000–2020.
While not new, it is worth noting here some further information on the sea-ice extent products used in the Outlook. For the Arctic, the NSIDC Sea Ice Index (Fetterer et al. 2017) is employed, as has been done for the history of the Outlook. This year for the Antarctic Outlook (Section 5 above), the EUMETSAT OSI-SAF product (Lavergne et al. 2019) is used. Both are based on passive microwave data, but use different algorithms. The differences in the product can be fairly large in absolute terms (0.5 to 1.0 x 10⁶ km2) (e.g., Meier et al. 2019), but these are generally consistent at a given time of year (i.e., the differences are biases between products) and trends and variability between products are largely consistent (e.g., Comiso et al. 2017). However, given the nature of the Outlook, the absolute extent is important for evaluating a given forecast. Ideally, where the observed extent (or concentration) is used for initialization of a forecast, the initialization field should use the same source as the observed September source. The 2020 SIO Post-Season Report illustrates the range of observed extent estimates from several sources (See: Section 3b). An ensemble approach may be useful in the future and will be considered for future Outlooks.
Section 7. Sea Ice Drift Forecast Experiment (SIDFEx) Results
Sea-ice drift forecasts for various buoys in the Arctic have been submitted by 13 different groups since 2017 in the framework of the Sea Ice Drift Forecast Experiment. Forecasts are made with lead times ranging from days to months. The seasonal forecasts (lead time up to 90 days or greater) of five groups are analyzed in this post-season report, in analogy to the SIDFEx post-season reports from the years 2018–2020. Four of the groups use dynamical models (AWI Consortium, ECMWF (SEAS5), APPLICATE (UCLouvain), and University of Washington/APL). The fifth (AWI sat_past) consists of a ten-member ensemble forecast based on the satellite-derived drift of the past ten years and can therefore be regarded as an observation-based climatological benchmark forecast.
In the previous post-season reports since 2017, we considered two (2017), three (2018), six (2019), and seven (2020) buoys. This year, we consider five buoys, three of which were already included in the 2020 post-season report. The buoys were relatively evenly distributed across the central Arctic, except for a coverage gap north of Fram Strait (Figure 22). We consider the forecasts as fairly representative for the Arctic regions which are still ice-covered by the end of the melting season.
Forecasts were initialized on 1 June, 1 July, and 1 August in line with the SIO submissions. We focus on the 15 September position and assess the forecast performance by means of ellipses (see Figure 22), which are derived from a 2D Gaussian fit to the forecast ensemble. The ellipses display the 90% quantile. Thus, the probability that the buoy is within this ellipse by 15 September is 90%, if the ensemble is reliable. We expect that the spatial uncertainty, reflected by the ellipses' area, decreases for later initialization dates (solid ellipses should be smaller than dashed and dotted ellipses).
 on 15 September 2021. Filled red squares give the buoys' positions on 15 September, open symbols show their positions in the months before (see legend for details). Panels a) - e): Forecast ellipses for all five buoys. Dotted, dashed, and solid lines correspond to forecasts initialized on the 1st of June, July, and August, respectively. The colors denote the group. Note that not all groups submitted forecasts for all targets and initialization dates; this explains the varying number of ellipses.")
This holds for all cases in which forecasts were submitted for all initialization dates (note that not all groups submitted a forecast for each target and initialization date). As already pointed out in the 2020 post-season report, the forecast ellipses for targets close to the coast (e.g., buoy 498190, Figure 22a) tend to be more eccentric, corresponding to the prevailing drift orientation parallel to the coast. Ellipses in the central Arctic (e.g., buoy 204762, Figure 22e) are more circular. Next, we assess the hit rates of the forecasts, i.e., how often the buoy was contained in the forecast ellipses. The hit rates range from 38% (Figure 22d) to 69% (Figure 22e), with a mean hit rate of 52%. This is a smaller range than in the 2020 post-season report, where hit rates ranged from 30% to almost 100%. The smaller range might simply be caused by the fact that more forecasts were available in 2020. Furthermore, we note that buoy 900121 in the Beaufort Sea (Figure 22c) did not show the typical clockwise rotation associated with the Beaufort Gyre, but moved counter-clockwise during the first weeks. This is concurrent with observations of a persistent low-pressure system above the Beaufort Sea in July, which induced counter-clockwise rotation (NSIDC, 2021).
8. References
Comiso, J. C., W. N. Meier, and R. Gersten. 2017. Variability and Trends in the Arctic Sea Ice Cover: Results from Different Techniques. Journal of Geophysical Research: Oceans, 122: 6883–6900. doi:10.1002/2017JC012768.
Fetterer, F., K. Knowles, W. N. Meier, M. Savoie, and A. K. Windnagel. 2017, updated daily. Sea Ice Index, Version 3. Boulder, Colorado USA. NSIDC: National Snow and Ice Data Center. doi: https://doi.org/10.7265/N5K072F8. [Accessed 2 October 2021].
Lavergne, T., A. M. Sørensen, S. Kern, R. Tonboe, D. Notz, S. Aaboe, L. Bell, G. Dybkjær, S. Eastwood, C. Gabarro, G. Heygster, M. A. Killie, M. Brandt Kreiner, J. Lavelle, R. Saldo, S. Sandven, and L. T. Pedersen. 2019. Version 2 of the EUMETSAT OSI SAF and ESA CCI Sea-Ice Concentration Climate Data Records. The Cryosphere, 13: 49–78. doi: https://doi.org/10.5194/tc-13-49-2019.
Lee, S., J. Stroeve, and A. Khan. 2020. Machine Learning Approaches to Retrieve Pan-Arctic Melt Ponds from Satellite Imagery. Remote Sensing of Environment, 247. doi:10.1016/j.rse.2020.111919.
Liston, G. E., P. Itkin, J. Stroeve, M. Tschudi, and J. S. Stewart. 2020. A Lagrangian Snow-Evolution System for Sea-Ice Applications (SnowModel-LG): Part I – Model Description. Journal of Geophysical Research: Oceans, 125. doi: https://doi.org/10.1029/2019JC015913.
Liston, G. E., J. Stroeve, and P. Itkin. 2021. Lagrangian Snow Distributions for Sea-Ice Applications, Version 1. Boulder, Colorado USA. NASA National Snow and Ice Data Center Distributed Active Archive Center. doi: https://doi.org/10.5067/27A0P5M6LZBI.
Markus, T., J. C. Stroeve, and J. Miller. 2009. Recent Changes in Arctic Sea Ice Melt Onset, Freeze-up, and Melt Season Length. Journal of Geophysical Research, 114. doi:10.1029/2009JC005436.
Meier, W. N., D. Perovich, S. Farrell, C. Haas, S. Hendricks, A. A. Petty, M. Webster, D. Divine, S. Gerland, L. Kaleschke, et al. 2021. Sea Ice. In Arctic Report Card 2021; Moon, T.A., M.L. Druckenmiller, R.L. Thoman, Eds.; NOAA; doi: https://doi.org/10.25923/y2wd-fn85.
Meier, W. N., and J. S. Stewart. 2019. Assessing Uncertainties in Sea Ice Extent Climate Indicators. Environmental Research Letters, 14(3), 035005, doi: https://doi.org/10.1088/1748-9326/aaf52c.
NSIDC. 2021: https://nsidc.org/arcticseaicenews/2021/07/neck-and-neck/, last access 24 November 2021.
Serreze, M. C., J. Stroeve, A. P. Barrett, and L. N. Boisvert. 2016. Summer Atmospheric Circulation Anomalies Over the Arctic Ocean and their Influences on September Sea Ice Extent: A Cautionary Tale. Journal of Geophysical Research, 121. doi: 10.1002/2016JD025161.
Stroeve, J. C., T. Markus, L. Boisvert, J. Miller, and A. Barrett. 2014. Changes in Arctic Melt Season and Implications for Sea Ice Loss. Geophysical Research Letters, 41: 1216–1225. doi:10.1002/2013GL058951.
Stroeve, J., G. Liston, S. Buzzard, L. Zhou, R. Mallett, A. Barrett, M. Tsamados, M. Tschudi, P. Itkin, and J.S. Stewart. 2020. A Lagrangian Snow-Evolution System for Sea Ice Applications (SnowModel-LG): Part II - Analyses. Journal of Geophysical Research: Oceans, 125. doi: https://doi.org/10.1029/2019JC015900.
Schroeder, D., D. L. Feltham, D. Flocco, M. Tsamados. 2014. September Arctic Sea-Ice Minimum Predicted by Spring Melt-Pond Fraction. Nature Climate Change, 4: 353–357. doi: https://doi.org/10.1038/NCLIMATE2203.
Tschudi, M., W. N. Meier, J. S. Stewart, C. Fowler, and J. Maslanik. 2019a. EASE-Grid Sea Ice Age, Version 4. Boulder, Colorado USA. NASA National Snow and Ice Data Center Distributed Active Archive Center. doi: https://doi.org/10.5067/UTAV7490FEPB. [Accessed 7 October 2021].
Tschudi, M., W. N. Meier, and J. S. Stewart. 2019b. Quicklook Arctic Weekly EASE-Grid Sea Ice Age, Version 1. Boulder, Colorado USA. NASA National Snow and Ice Data Center Distributed Active Archive Center. doi: https://doi.org/10.5067/2XXGZY3DUGNQ. [Accessed 7 October 2021].
9. Report Credits
This 2021 Sea Ice Outlook Full Post-Season Report was developed by the SIPN2 Leadership Team with contributions from several of our partners and collaborators.
Report Lead:
Uma Bhatt, University of Alaska Fairbanks, Geophysical Institute
Additional Contributors:
Peter Bieniek, University of Alaska Fairbanks, International Arctic Research Center
Cecilia Bitz, University of Washington, Program on Climate Change
Edward Blanchard-Wrigglesworth, University of Washington, Department of Atmospheric Sciences
Hajo Eicken, University of Alaska Fairbanks, International Arctic Research Center
Matthew Fisher, National Snow and Ice Data Center
Helge Goessling, Alfred-Wegener Institute, Helmholtz Centre for Polar and Marine Research
Larry Hamilton, University of New Hampshire, Carsey School of Public Policy
Joseph Little, University of Alaska Fairbanks, School of Management
Valentin Ludwig, Alfred-Wegener Institute, Helmholtz Centre for Polar and Marine Research
François Massonnet, Université Catholique de Louvain (Belgium)
Walt Meier, National Snow and Ice Data Center
James Overland, NOAA, Pacific Marine Environmental Laboratory
Mark Serreze, University of Colorado Boulder, NSIDC
Michael Steele, University of Washington, Applied Physics Laboratory
Julienne Stroeve, University College London, National Snow and Ice Data Center
John Walsh, International Arctic Research Center, University of Alaska Fairbanks
Muyin Wang, NOAA and the Joint Institute for the Study of the Atmosphere and Ocean at the University of Washington
Helen Wiggins, Arctic Research Consortium of the US (ARCUS)
Editors:
Betsy Turner-Bogren, ARCUS
Helen Wiggins, ARCUS
Lisa Sheffield Guy, ARCUS
Suggested Citation:
Bhatt, U. S., P. Bieniek, C. M. Bitz, E. Blanchard-Wrigglesworth, H. Eicken, H. M. Fisher, Goessling, L. C. Hamilton, E. Hunke, T. Jung, J. Kurths, J. Little, V. Ludwig, F. Massonnet, W. Meier, J. E. Overland, M. Serreze, M. Steele, J. Stroeve, J. Walsh, M. Wang, and H. V. Wiggins. Editors: Turner-Bogren, B., and L. Sheffield Guy. February 2022. "2021 Sea Ice Outlook Post-Season Report." Published online at: https://www.arcus.org/sipn/sea-ice-outlook/2021/post-season.
This Sea Ice Outlook Report is a product of the Sea Ice Prediction Network–Phase 2 (SIPN2), which is supported in part by the National Science Foundation under Grant No. OPP-1748308. Any opinions, findings, and conclusions or recommendations expressed in this material are those of the author(s) and do not necessarily reflect the views of the National Science Foundation.