Outlook Report
Executive Summary
Thank you to the groups that contributed to this 2018 June Sea Ice Outlook (SIO) report. We received 34 contributions that include pan-Arctic predictions, of those contributions 10 also included pan-Antarctic predictions and 11 included predictions for Alaskan waters. We received one additional contribution with a regional focus on the Nares Strait.
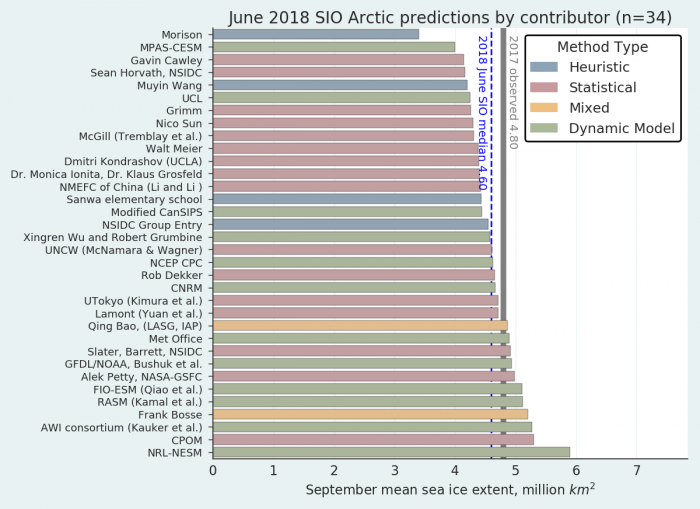
For the Arctic, the median June Outlook value for a September 2018 sea ice extent projection is 4.6 million square kilometers with quartiles of 4.4 and 4.9 million square kilometers (See Figure 1 in the Overview section, below). Contributions are based on statistical, dynamical models, and heuristic methods. These projections are slightly larger and show less spread compared with last year’s June Outlook median and quartile values for September extent of 4.1, 4.4, and 4.7 million square kilometers. To place this year's Outlook in context, consider recent observed values of 4.3 million square kilometers in 2007, 3.6 million square kilometers in 2012, and 4.7 million square kilometers in 2016. For September 2018, only two estimates are below 4.0 million square kilometers. Thus, there is a collective opinion against a new record low September sea ice extent.
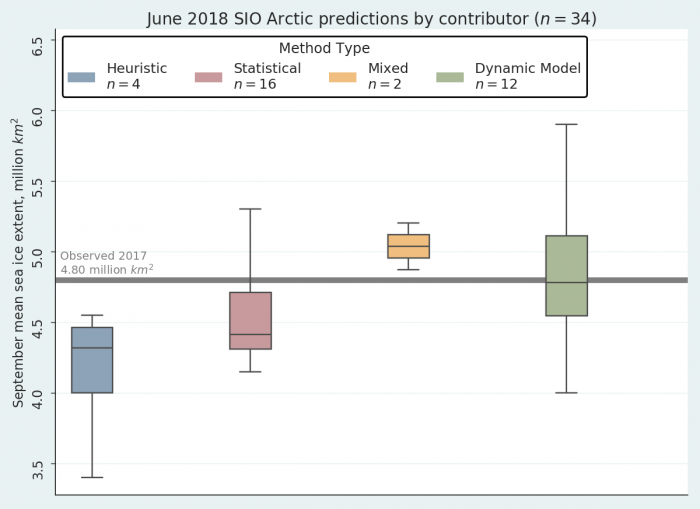
There was a considerable spread in the results from numerical models. Statistical and heuristic approaches had generally lower September sea ice extent projections compared to the overall median.
As in previous years May sea ice extents were well below the long-term average. Observed and predicted weather for June is not particularly favorable for rapid summer sea ice retreat.
The June report is the product of the Sea Ice Prediction Network–Phase 2 (SIPN2) effort. The goal of the previous SIPN1 was to enhance scientific discussion on the physics that control summer sea ice extents. In SIPN2 there is a further analysis of quantitatively comparing model forecast output. New to the SIO, all participants whose methods provided information at the local scale were encouraged to provide full spatial fields via the new SIPN Data Portal for computation of metrics such as sea ice probability (SIP) and first ice-free (IFD) as well as additional regional analysis for the Sea Ice Outlook.
This report includes a section on predicted spatial fields with discussion on sea ice probability (SIP) and the first ice-free day (IFD) from a number of dynamical models; a section on current conditions with discussion on this winter's record low sea ice conditions and atmospheric conditions; a section discussion regional ice conditions; and a section discussing Antarctic sea ice extent forecasts.
Contributions to the 2018 SIPN/Year of Polar Prediction community forecast experiment, the Sea Ice Drift Forecast Experiment (SIDFEx), are coming in. Results will be discussed in a future Sea Ice Outlook report.
This June Outlook was developed by lead author James Overland, NOAA/PMEL (Overview and discussion of current conditions); Bruce Wallin, NSIDC (statistics and graphs); Cecilia Bitz and Edward Blanchard-Wrigglesworth, U. Washington (Discussion on predicted spatial fields); François Massonnet, Université Catholique de Louvain, Belgium (Discussion of Antarctic contributions); Betsy Turner-Bogren, Helen Wiggins, and Stacey Stoudt, ARCUS (report coordination and editing); and the rest of the SIPN2 Leadership Team.
Please note: The Sea Ice Outlook provides an open process for those interested in Arctic sea ice to share predictions and ideas; the Outlook is not an operational forecast.
See: June call for contributions
Overview
The 34 Arctic June Outlook contributions for September 2018 sea ice extent projections are again based on multiple approaches (Figure 1). There were 4 contributions using a heuristic (qualitative analysis) approach, 2 mixed contributions that rely on a combination of statistical and heuristic approaches, 16 contributions using statistical methods, and 12 using dynamical (based on physics equations) models.
For the Arctic, the median June Outlook value for September 2018 sea ice extent prediction is 4.6 million square kilometers with quartiles of 4.4 and 4.9 million square kilometers. Projections from dynamic models have the largest spread of contributed outlooks, while the predictions of September extent by heuristic and statistical methods show lower values compared with mixed methods and dynamical models (Figure 2).
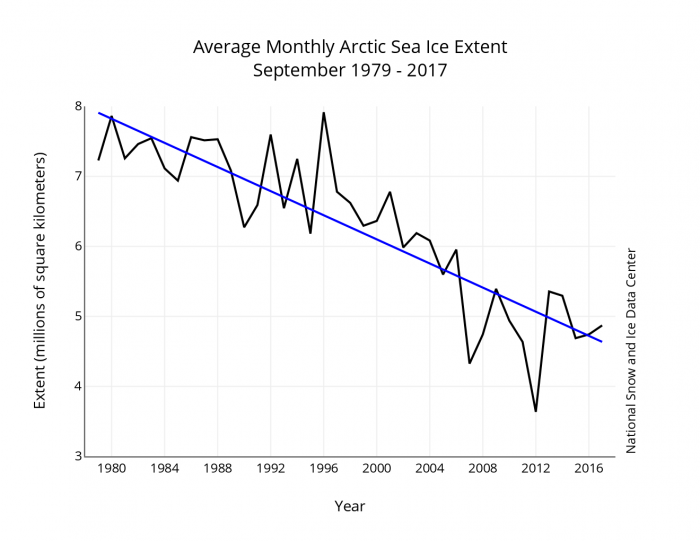
This years’ median projected value of 4.6 million square kilometers compares to the projected values of 4.4 million square kilometers for 2017 and 4.7 million square kilometers for 2016. Except for the highest and the two lowest contributions, all estimates are in a fairly narrow range of a bit more than 1.0 million square kilometers. Thus, there is a collective opinion that projections should be close to persistence (based on recent observations), and against rapid large decreases in summer Arctic sea ice. Figure 3 shows the historical data for September sea ice extent. Extent for recent years is near the long term downward trend line. Extreme minima in 2007 and 2012 appear to be singular events that were forced by warm temperatures and an unusual pattern of winds.
Sea Ice Probability (SIP) and First Ice-Free Date (IFD) Predictions from Spatial Fields
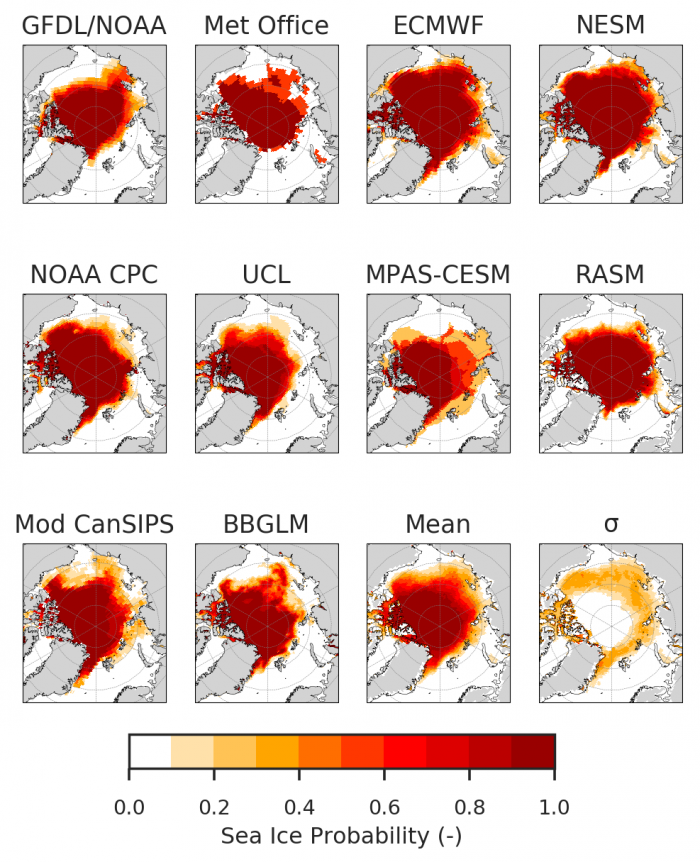
As in recent years, we have invited contributions of sea ice probability (SIP) and first ice-free date (IFD). Additionally, SIPN is now producing SIP and IFD forecasts directly from contributors’ sea ice concentration (SIC) forecasts, and we encourage all groups to submit full field SIC forecasts whenever possible. SIP is defined as the fraction of ensemble members in an ensemble forecast with September ice concentration in excess of 15%. IFD is the first date in the melt season at which the ice concentration at a given location first drops below 15%. So far this year, we have received 10 submissions of SIP (9 dynamical, 1 statistical) and 7 of IFD.
Sea Ice Probability (SIP):
Most forecasts show open conditions for the Chukchi Sea and the Alaskan coast. Elsewhere, forecasts are uncertain showing significant spread across models, particularly in the Laptev and East Siberian seas, where some models show high ice conditions (ECMWF, NESM), and others low ice conditions (UCL, Met Office). There is a reasonable chance for the Northeast Passage to be ice free this summer (mean SIP of ~30%).
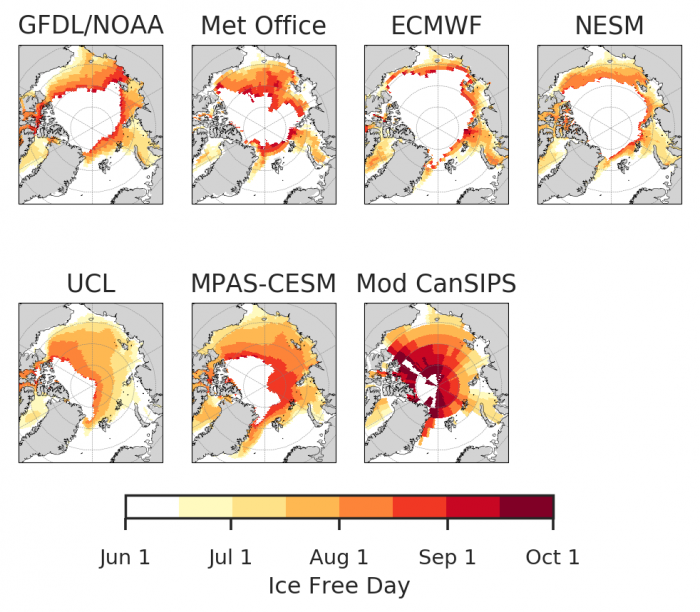
First Ice-Free Date (IFD):
Forecasts of IFD also show significant spread across models in some regions, particularly the Chukchi, East Siberian, Laptev, and Alaskan Seas. In the Kara and Barents there is much better agreement across models.
Current Conditions
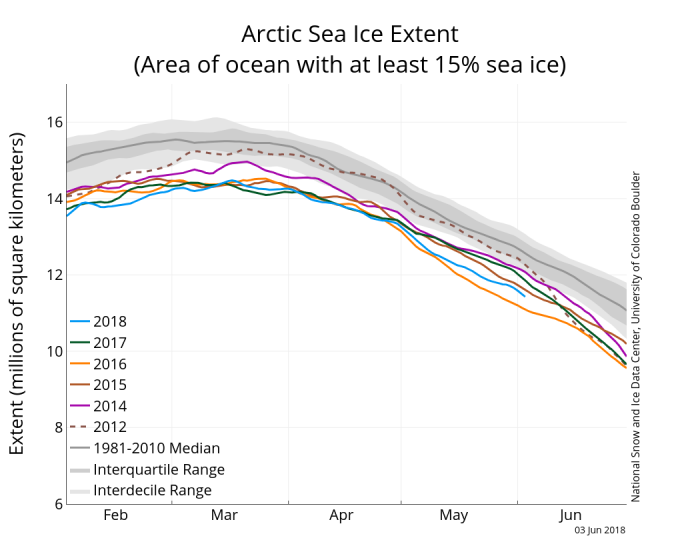
2018 had the second lowest May sea ice extent in the passive microwave satellite record (Figure 6, NSIDC). 2018 was the fourth sequential year with unprecedented low winter and spring sea ice coverage. As has been the case in recent winters, the winter of 2017/2018 saw extreme high air temperatures. Because thin ice grows faster for the same thermodynamic forcing (i.e. temperature and long wave radiation), conventional wisdom has been that even with a delayed fall freeze up or high winter air temperatures, sea ice growth would be rapid and there would be no spring “memory” of these influences. The results in Figure 6 suggest that this assumption may no longer hold. While four years of data is too short to conclude that there has been a climate shift, the fact of sequential low sea ice, rather than a one year random event, is highly suggestive of new Arctic conditions.
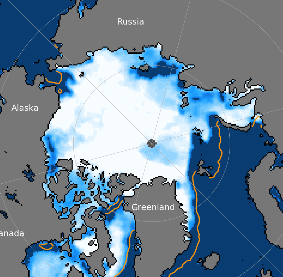
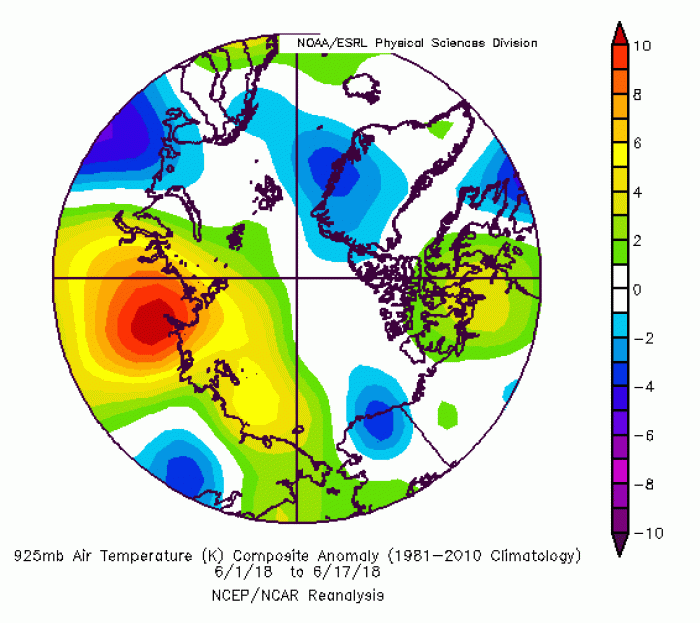
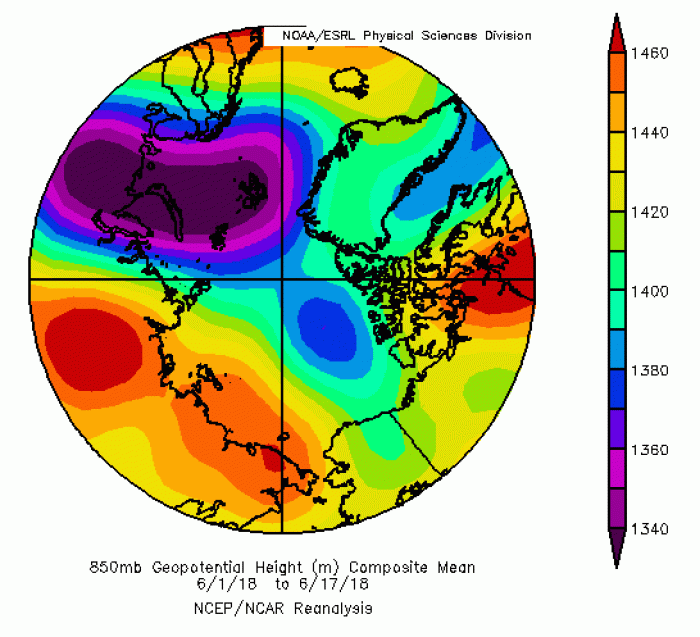
The early June sea ice concentration map (Figure 7, NSIDC) shows low values along the western Siberian coast, the Chukchi and eastern Beaufort Seas, and relatively low concentration in the central Amerasian Basin. Air temperature anomaly plots for the first weeks of June just above the surface (at 925 mb) have unusually warm conditions (positive anomalies) along the western Siberian coast and negative anomalies on the Greenland side (Figure 8). Such conditions are consistent with the atmospheric wind patterns (Figure 9); wind directions broadly follow the contours of the 850 mb geopotential height field (i.e., the height of a constant atmospheric pressure surface about 15 % above the surface). A high geopotential height center along the Siberian coast brought warm air from the continent out over the areas with low sea ice concentration.
In early June, a major storm formed in the Kara Sea and moved to the Amerasian Basin. The storm’s central pressure (a measure of its strength) bottomed out on 7 June at 966 mb, placing it on par with the Great Arctic Cyclone of 2012, and making it one of the major early summer storms since 1958. The passage of a storm can result in broken ice floes that can melt quickly in the next few months, and the wind trajectory near Svalbard may be transporting thick ice out of the Arctic.
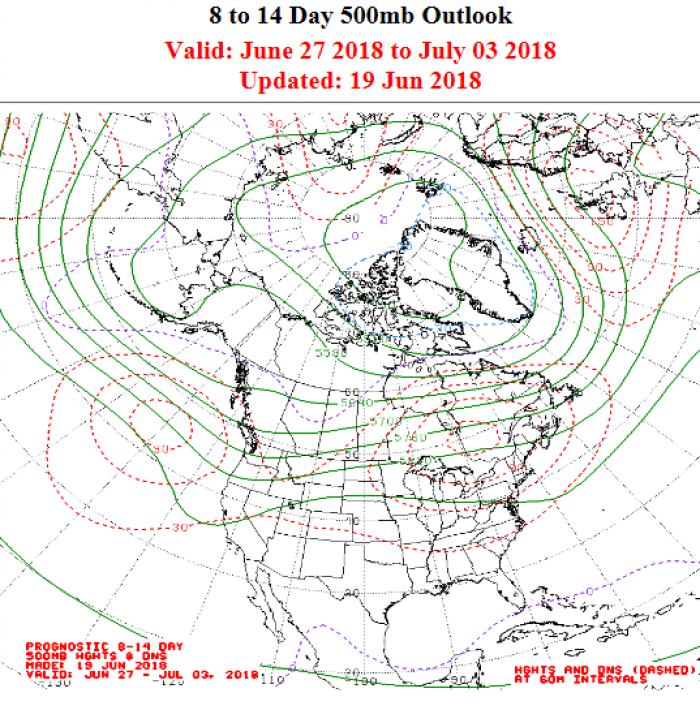
The two-week forecast of meteorological conditions (Figure 10) shows a maintenance of low geopotential heights over northeast Canada and extending out over the central Arctic (green contours of 500 mb geopotential heights). A strong jet stream (close contour spacing) is projected over the central Pacific, North America, and North Atlantic. These two features tend to isolate the Arctic from mid-latitude impacts and suggest that the current basic weather pattern will continue at least through late June.
From NOAA ESRL plotting routines.
Regional Sea Ice Extent Discussions
Alaska Regional Extent Outlooks
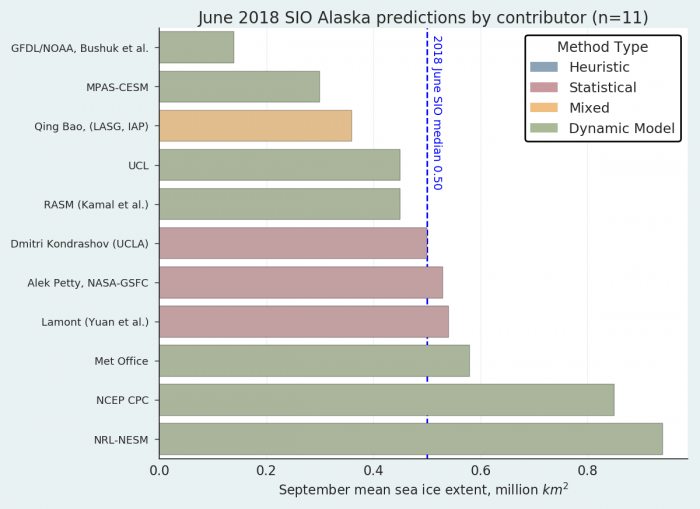
We received 11 Alaskan regional Outlooks (combination of the Bering, Chukchi, and Beaufort Seas) this month. The median Outlook is 0.47 million square kilometers.
Bering Sea
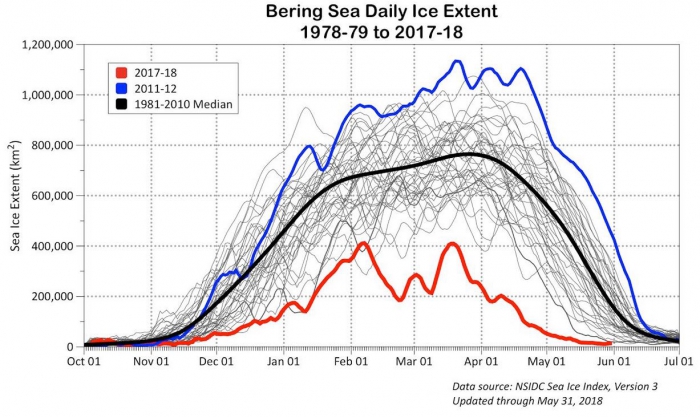
In the winter of 2017-2018, the Bering Sea was the site of an extremely reduced sea ice extent compared to previous years (Figure 12). This followed low sea ice extent and late freeze up in the Chukchi Sea in fall 2017. Normal sea ice advance was retarded during late February and March by unusual west-southwest winds. Ecosystem and societal impacts from lack of sea ice were large. Walrus did not have their normal habitat. Sea ice was not available for normal coastal transit of people. Cold temperatures and stabilization of the water column by melting sea ice are a normal spring feature of the northern Bering Sea. This supports the formation of a bottom cold pool (an ocean layer of cold temperatures), which is favorable for a food supply for commercial fish species. Due to the lack of 2018 sea ice, the fate of the cold pool in summer 2018 is unknown.
Nares Strait 2018
Summary of contribution from Preben Gudmandsen, Professor emeritus, National Space Institute, Technical University of Denmark
(The full contribution is included as a PDF at the end of this report.)
After more than two months of anomalous winter, the “Ice Bridge” (a blocking of further sea ice motion due to the forming of an east-west arch in the sea ice due to internal ice physics) formed again in the southwestern corner of the Kane Basin on 1 March 2018. This resulted in a complete stop of ice drift to the south, and a gradually decreasing compression of ice in the northern part of the Nares Strait between Greenland and Ellesmere Island to the west.
Figure 13 shows the status of the ice bridge on 5 June 2018, using a Sentinel 1B acquisition. The main adjustments occurred at both sides of the bridge, changing the attachments to the coast of Ellesmere Island (Bache Peninsula and Pim Island) and to the stationary ice in the Kane Basin.
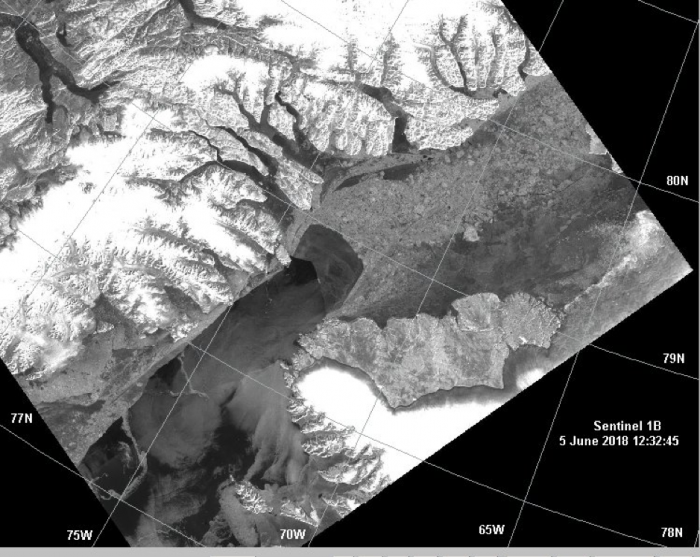
The winter months referred to were very different from normal years with air temperatures 10 to 15 ˚C higher than previous observations. A number of polynyas formed along the coast of Greenland. A very frequent polynya is the one formed by strong northern winds south of Franklin Island that may extend far beyond Crozier Island to reach the Kane Basin. We include an example of an acquisition by the Advanced Microwave Scanning Radiometer system (AMRS2) in Figure 14. Open ice-free areas (ice concentration < 15%) are shown in dark blue with gradation to light blue, green, yellow, red, and cyclamen as ice cover approaches 90 to 100%.
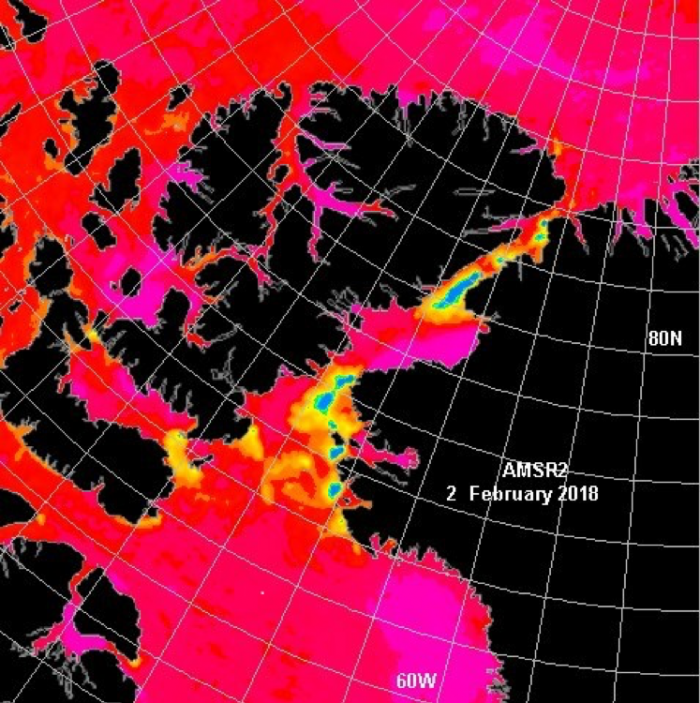
The apron of new ice featured in Figure 14 may be important for the stability of the Ice Bridge in several ways. It prevents erosion of the edge of the Bridge and reduces the influence of the high tides prevalent in the area. Also, it will strengthen the Ice Bridge vis à vis north-coming forces. We hope that we may enjoy seeing this good example of an Ice Bridge for more than the present month of June.
Antarctic Discussion
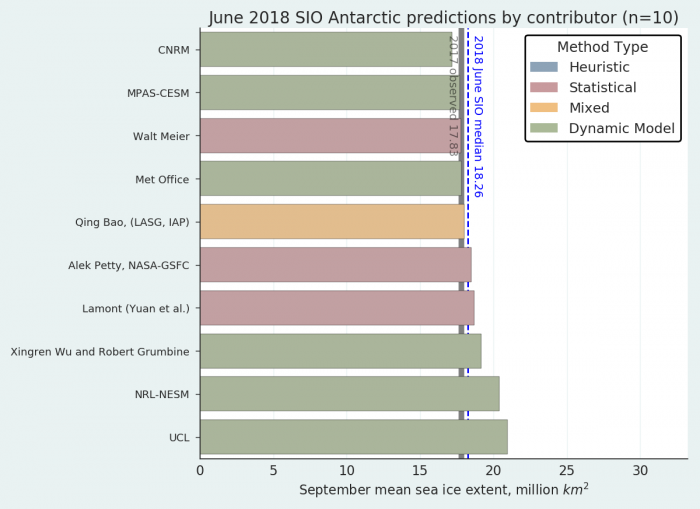
As was the case last year, several SIO participants submitted Antarctic contributions. This year, 10 outlooks of September mean sea ice extent were received (compared to 7 for last year), showing the growing interest in sea ice prediction in the Southern Ocean. We are grateful to all contributors for making their forecasts available.
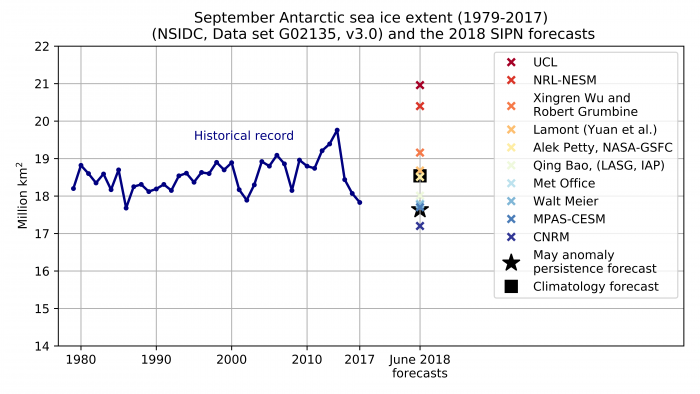
The 10 forecasts cover the range 17.1 - 21.0 million km² (Figure 15), which is 180 % of the historical range from observations. Remarkably, the interquartile range for these Antarctic submissions (17.8 - 19.0 million km²) is more than twice that of Arctic submissions (4.4 - 4.9 million km²)
From the (small) number of submissions available, it is surmised that the prediction systems taken together will probably not outperform a climatological (18.5 million km²) or a persistence-based forecast (17.6 million km²). We are awaiting the next submissions (July and August) to confirm this statement.
The sister project of SIPN2, the Sea Ice Prediction Network South (SIPN South, Massonnet et al., 2018) launched in 2017, aims at analyzing in more details the (summer) Antarctic sea ice forecasts, understand the regional expressions of forecast biases, and deliver information that is more tailored to end users. An initial analysis of austral summer 2018 forecasts has revealed that the spread in forecasted circumpolar sea ice area was as large as that reported here for winter contributions, and that most forecast systems had difficulties in predicting sea ice retreat in the Ross Sea.
Key Statements/Executive Summaries From Individual Outlooks
A PDF of a table containing the key statements/summaries from all of the Outlooks is available as the first file under the "Individual Outlook PDFs" section below. All individual full contributions are also below as separate PDFs. Note that the regional contribution on the Nares Strait has a full contribution but is not part of the key statement table.
Report Credits
This post-season report was developed by the SIPN2 Leadership Team
Report Lead
Jim Overland, NOAA/Pacific Marine Environmental Laboratory
Additional Contributors:
Bruce Wallin, University of Colorado, Boulder, NSIDC
Preben Gudmandsen, Professor emeritus, National Space Institute, Technical University of Denmark
Editors:
Betsy Turner-Bogren, ARCUS
Helen Wiggins, ARCUS
Stacey Stoudt, ARCUS
Individual Outlook PDFs
| Attachment | Size |
|---|---|
| Summary Table of Key Statements from Outlooks186.66 KB | 186.66 KB |
