
Summary
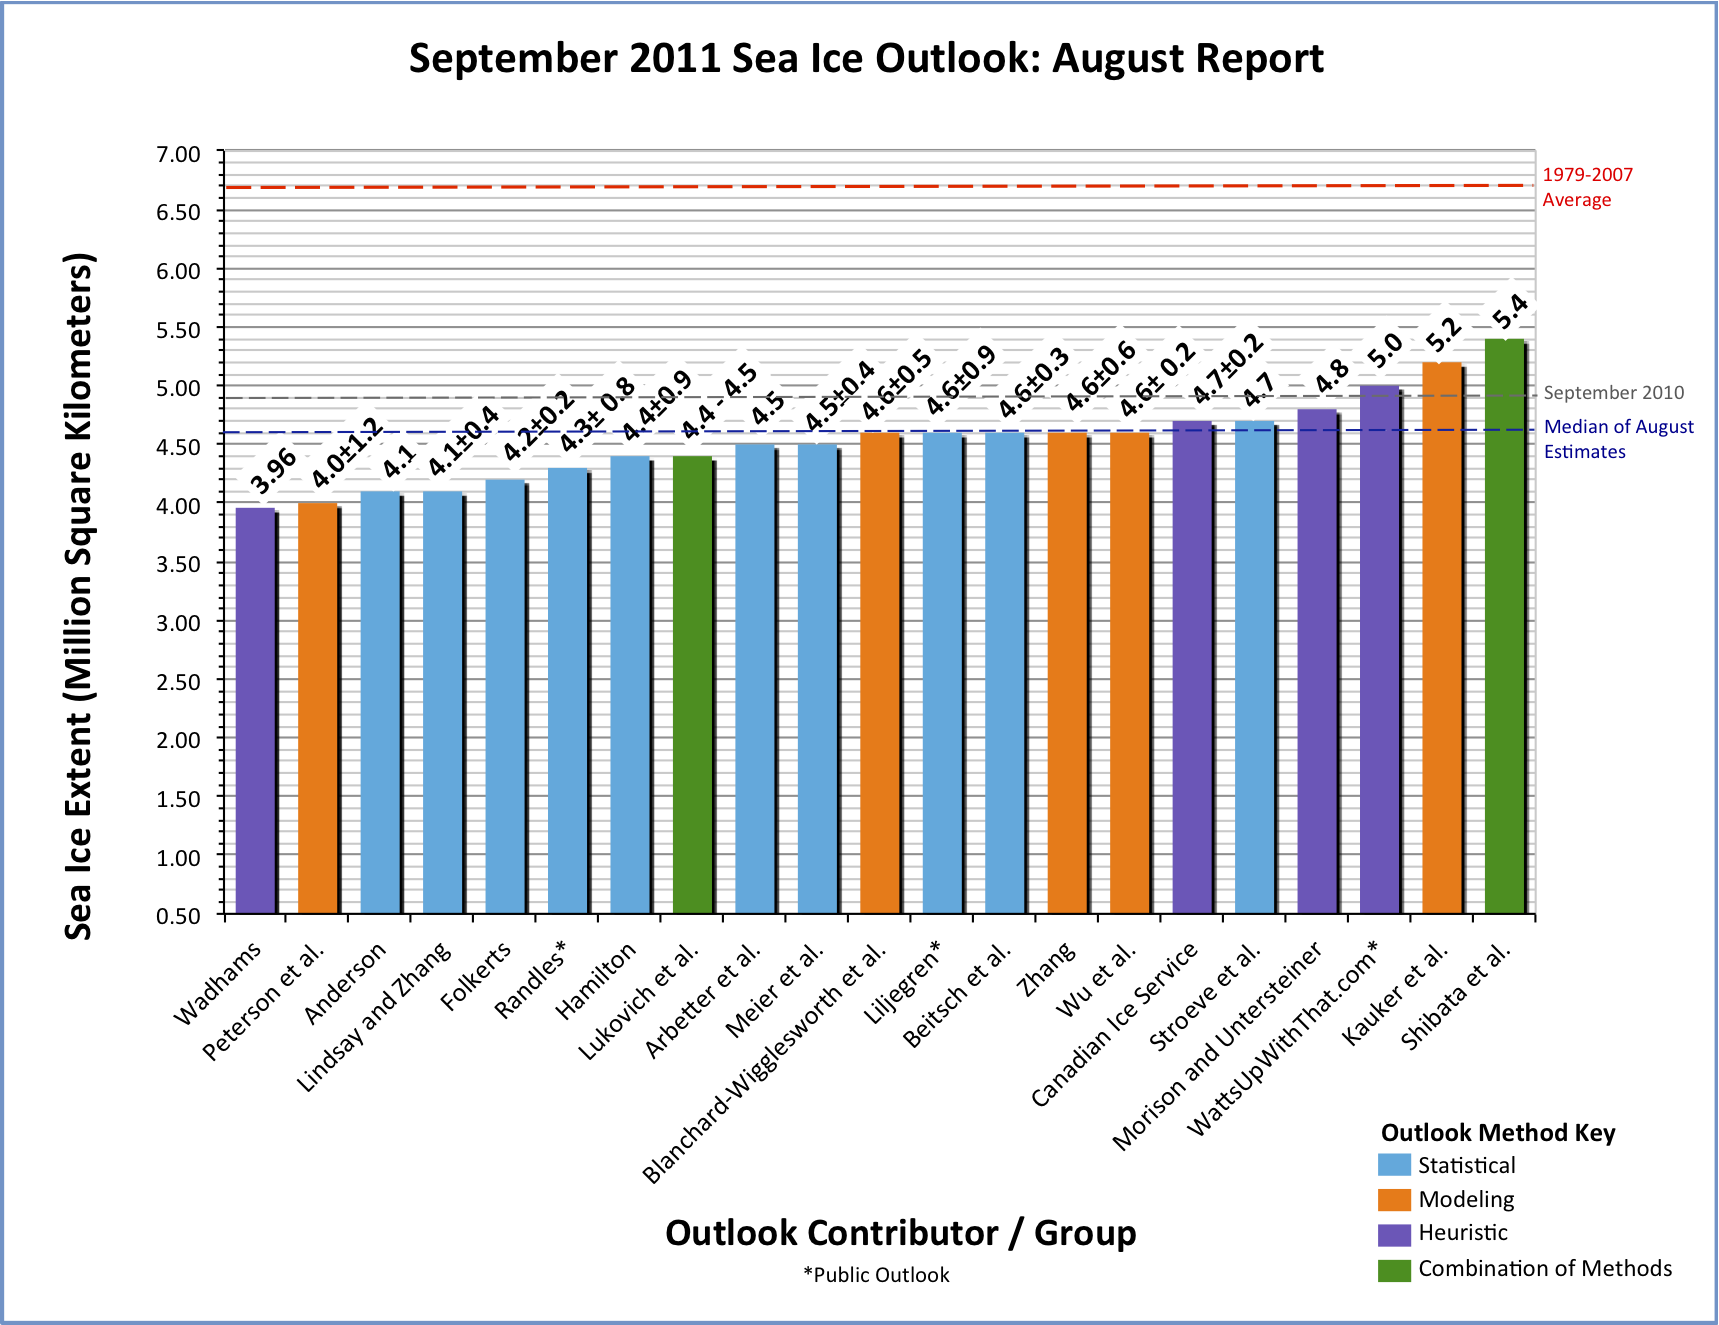
Many thanks to all contributors to the August Sea Ice Outlook. We received 21 responses for the Pan-Arctic report (Figure 1), with estimates in the range of just below 4.0 million square kilometers to as high as 5.4 million square kilometers for the September arctic mean sea ice extent. As in the July Outlook, the median value was 4.6 million square kilometers with quartile values of 4.3 and 4.6 million square kilometers, a rather narrow range. All contributions are well below the 1979-2007 climatological mean of 6.7 million square kilometers, and also below all values seen prior to 2007. Thus, the low values observed the last four summers are expected to continue again this September. On a regional level, the long-term downward trend is expected to continue in all regions except the Greenland Sea.
July 2011 set a new record low for the month during the satellite data record despite a significant slowing down of ice loss during the latter half of the month as weather changed to cooler conditions. In August, warmer conditions returned, which combined with a rather diffuse ice cover in the Beaufort and Chukchi seas, has led to a speed-up in the rate of ice loss at the beginning of August, particularly in the Chukchi Sea. Whether or not this rate of ice loss will continue will depend on what the weather does over the next few weeks. However, with approximately a month left in the melt season, it is very unlikely that the September minimum will end up above 5 million square kilometers.
 values for September 2010 sea ice extent. Credit: Arctic Research Consortium of the U.S. (ARCUS). Click to enlarge.")
Pan-Arctic Outlook
Overview of Results
We received 21 contributions to the August Outlook, 18 from the scientific community and 3 from the general public. The range of projections ranges from just below 4.0 million square kilometers to 5.4 million square kilometers, with 18 of the 21 projections suggesting a September minimum below 5.0 million square kilometers (Figure 1). The median value is 4.6, with quartile values of 4.3 and 4.6 million square kilometers. Again it is important to remember that the Outlook values are for the mean arctic September sea ice extent as provided by the National Snow and Ice Data Center (NSIDC). Other sources for sea ice extent exist, based on different sensors and/or algorithms. If these sources are used, the corresponding mean monthly ice extent values can be adjusted by an offset to roughly correspond to the NSIDC value.
Download High Resolution Version of Figure 1.
As the melt season draws to a close, many of the forecasts based on statistical linkages between the end of July ice conditions and the September minimum improve in their forecasting skill. While several August Outlooks did not change from the July Outlook, forecasts using statistical techniques together with end of July sea ice conditions tended to show slightly lower estimates for the September minimum compared to the previous outlook (e.g. Meier et al.; Beitsch et al.; Lukovich et al.; Randles). However, the slowdown of ice loss during the second half of July, as a series of low-pressure systems moved into the central Arctic Ocean and replaced the high-pressure cell over the northern Beaufort Sea, led to some forecasts increasing compared to the July Outlook (e.g. Arbetter et al., Zhang).
It is clear from all the contributions submitted this summer that, as in recent years, neither a return to September ice extents as seen in the 1980s and 1990s nor a return to the linear trend line are expected this year. Could this imply that the sea ice cover has entered a new state? While the seasonal ice loss the last several years (2007-2010) exceeds that seen in any prior years, perhaps forced in part by thinning following the 2007 minimum, a recent paper by Kay et al. (Geophys. Res. Lett., 2011, doi:10.1029/2011GL048008) evaluated the NCAR CCSM4 model arctic sea ice trends and found that on time-scales less than 10 years, it's equally possible for the September sea ice to increase or decrease even into the 21st century. Thus, while there has been persistence of low summer ice conditions the last few years, model results suggest we cannot rule out short periods of increased sea ice cover, but that this in no way contradicts the long-term sea ice loss.
Summer Sea Ice and Atmospheric Conditions
Throughout summer the sea ice extent was at or below previous record sea ice extents. According to NSIDC, July 2011 set a new record low during the satellite data record for the month, ending up 210,000 square kilometers below the previous record low set in July 2007 (Figure 2).

However, during the second half of July, ice loss slowed substantially as the high pressure over the central Arctic and Beaufort Sea was replaced by low sea level pressure (Figure 3). Corresponding temperatures showed significant cooling in the later half of the month, helping to slow ice loss. However, the Beaufort Sea High has re-established during August, combined with a strong low over Eurasia, leading to enhanced transport of ice through Fram Strait and acceleration in the rate of ice loss, particularly in the Chukchi Sea (Figure 4). The Beaufort Sea High is predicted to continue through the next few days. Given the rather diffuse ice cover in the Beaufort and Chukchi seas (Figure 5) combined with a return to favorable atmospheric conditions for ice removal, ice loss thus far in August has been faster than the 1979-2000 climatology.
 and 16–31 July 2011 (right). Credit: NOAA Earth System Research Laboratory Physical Sciences Division.")
, 2007 (dotted green line), and the 1979-2000 mean (gray line) + 2 standard deviations (shaded gray) based on the NASA Team sea ice algorithm. Credit: National Snow and Ice Data Center.")

Arctic Shipping Routes
During July there was further opening of the Northern Sea Route, the shipping lane that runs along the Eurasian Arctic coast from Murmansk on the Barents Sea, along Siberia, and through the Bering Strait. The Northwest Passage, while not yet open, has shown ice loss in the passage that is well ahead of average, according to the Canadian Ice Service. It is still possible that a navigable channel will open through the passage this summer. More details can be found in the Regional Sea Ice Outlook.
Further Loss of the Arctic's Store of Old Ice Maslanik et al. (Geophys. Res. Lett., 2011, doi:10.1029/2011GL047735) recently published an update of changes in the age of the Arctic's sea ice cover. The study looked at arctic-wide changes in ice age as well as regional changes and noted that the fraction of total ice extent made up of multiyear ice in March decreased from 75% in the mid 1980s to 45% in 2011. The largest changes occurred in the oldest ice (i.e., ice at least five years or older), decreasing from 50% of the multiyear pack to only 10% this past March (Figure 6). Regionally, the Canada Basin has experienced the largest declines in multiyear ice coverage, decreasing by 83% from 2002 to 2009. Further analysis suggests that more multiyear ice is now lost in the Pacific sector than elsewhere in the Arctic Ocean. This may have important implications for the future evolution of the arctic sea ice cover.
.")
Update on Sea Ice Melt
Ice mass balance buoy data are autonomous systems designed to measure and attribute the thermodynamic contribution to changes in the sea ice mass balance. Data from buoys installed by the Cold Regions Research and Engineering Laboratory (CRREL) show that surface melt at buoys located in the vicinity of the ice edge show melt consistent with previous years (Figure 7). Buoys located closer to the North Pole are showing a relatively high degree of surface melt, with an average amount of surface melt since 2000 of approximately 20 cm. While surface melt is likely to reach a maximum in August, bottom melt has just gotten underway at all the sites and is expected to continue beyond the date of the September minimum ice extent, as a result of storage of solar heat in the upper ocean.
 sites on 20 July 2011 (CRREL).")
Figure 7: CRREL
Key Statements from Individual Outlooks
Shibata et al. (Kitami Institute of Technology); 5.4; Heuristic, Statistical
Prediction is based on sea ice thickness, summer melt, outflow, and cloudiness. The primary variable, however, is ice thickness in spring, derived from AMSR-E 36 GHz polarization ratio. Considering no special atmospheric pattern for enhanced ice melt or ice export out of Fram Strait results in an estimate of 5.4 million square kilometers.
Kauker et al. (Alfred Wegener Institute for Polar and Marine Research); 5.2 ± 0.3; Model
For the present outlook the coupled ice-ocean model NAOSIM has been forced with atmospheric surface data from January 1948 to July 21, 2011. This atmospheric forcing has been taken from the NCEP/NCAR reanalysis (Kalnay et al., 1996). We used atmospheric data from the years 1991 to 2010 for the ensemble prediction. The model experiments all start from the same initial conditions on July 21, 2011. We thus obtain 20 different realizations of sea ice development in summer 2011. We use this ensemble to derive probabilities of ice extent minimum values in September 2011.
WattsUpWithThat.com (Public Contribution-Poll); 5.0; Heuristic
Website devoted to climate and weather polled its readers for the best estimate of 2011 sea ice extent minimum by choosing bracketed values from a web poll (http://wattsupwiththat.com/2011/07/27/august-arcus-forecast-poll-what-w…). 18.27% chose 5.0 to 5.1 million km2 or greater, with second greatest vote of 10.93% choosing 4.9 to 5.0 million sq km2. 8.53% of voters cast for less than 4.5 million km2.
Morison and Untersteiner (Polar Science Center, APL-U. of Washington); 4.8; Heuristic
The ice extent is now slightly above 2007. As we argued in June, if loss rates don't become anomalously large in the next couple of months, the ice extent should be a little greater than the extent in 2007. Prediction unchanged from July.
Stroeve et al. (National Snow and Ice Data Center); 4.7; Statistical
This estimate uses the same approach as last year: survival of ice of different ages based on ice age fields provided by Chuck Fowler and Jim Maslanik (Univ. Colorado, Boulder). However, this year we are using a revised ice age product, one based on a 15% sea ice concentration threshold rather than the earlier version, which used a threshold of 40% (see Maslanik et al., 2011 for more details). The use of a 15% threshold on sea ice concentration captures greater detail within the marginal ice zone, matches NSIDC's threshold used for mapping overall sea ice extent, and should therefore provide a better estimate of the September 2011 ice extent. Prediction unchanged from July.
Canadian Ice Service; 4.7 ± 0.2; Heuristic
Based on end-of-winter multiyear ice (MYI) extent, including the fact that MYI did not experience free passage through Nares Strait throughout the winter of 2011 as it did in 2007 and 2010, together with evaluation of surface air temperature and sea level pressure patterns results in a September minimum ice extent forecast between 4.5 and 4.9 million square kilometers. Prediction unchanged from July.
Wu et al. (National Oceanic and Atmospheric Administration); 4.6 ± 0.2; Model
The NCEP Coupled Forecast System (CFS) model with 10 initial conditions from June 1 to June 10, 2011 was run. These were modified from the CFS v2.0 initial conditions by thinning the ice pack 60cm. If ice less than 20cm occurred, the minimum thickness was left at 20cm. The modeled extent with a 15% sea ice concentration cutoff is reported.
Zhang (Applied Physics Lab, University of Washington); 4.6 ± 0.6; Model
This is based on numerical ensemble predictions starting on 8/1/2011 using the Pan-arctic Ice-Ocean Modeling and Assimilation System (PIOMAS). The ensemble consists of seven members, each of which uses a unique set of NCEP/NCAR atmospheric forcing fields from recent years representing recent climate.
Beitsch et al. (University of Hamburg); 4.6 + 0.3; Statistical
The estimate is based on AMSR-E sea ice concentration data derived using the ARTIST sea ice (ASI) algorithm (Spreen et al., 2008; Kaleschke et al., 2001). To obtain an estimate, a sea ice area from the Arctic Basin (excluding the pole and the multiyear sea ice north of Greenland) is regressed with the previous years and their September mean extents. Daily updates can be found here: http://icdc.zmaw.de/cryosphere.html?&L=1
Liljegren (Public Contribution); 4.6 + 0.9; Statistical
Prediction is based on using the JAXA sea ice extent from July 28, 2011 in a linear regression model based on July 28 sea ice extents and September minimum values since 2002.
Blanchard-Wrigglesworth et al. (University of Washington); 4.6 ± 0.5; Model
Our forecast uses a state-of-the-art General Circulation Model (GCM) initialized with average May 2011 sea ice area and volume anomalies obtained from the Pan-arctic Ice-Ocean Modeling and Assimilation System (PIOMAS). The GCM used is the National Center for Atmospheric Research (NCAR)'s Community Climate System Model version 4 (CCSM4) [1] at 1_ resolution in all components. Prediction unchanged from July.
Meier et al. (National Snow and Ice Data Center); 4.5 ± 0.4; Statistical
This statistical method uses previous years' daily extent change rates from July 27 through September 30 to calculate projected daily extents starting from June 30. The September daily extents are averaged to calculate the monthly extent. Rates from recent years are more likely to occur because of the change in ice cover. Thus, the official projection is based on the rates for 2002-2010.
Arbetter et al. (National Ice Center) 4.5; Statistical
The August update uses conditions from the last week in June, approximating the method used for the standard North American Ice Service (NAIS) Outlook. The model is constrained by the last 10 years of sea ice behavior in the Arctic. As in 2010, the August outlook is more conservative than the July update, reflecting the slow-down of ice loss during the month of August. The date of minimum occurrence is predicted to be September 20.
Lukovich et al. (Centre for Earth Observation Science, U. of Manitoba); 4.4 to 4.5; Heuristic-Dynamics
The absence of a strong and persistent sea level pressure high over the Beaufort in July together with the absence of spatial homogeneity in the springtime sea ice drift fields suggest that continued sea ice decline will be an artifact of increased temperatures and thermodynamic forcing rather than the considerable dynamical contributions seen in summer of 2007. However, deformation of a very fractured ice cover in response to regional wind-forcing may also play a role.
Hamilton (University of New Hampshire); 4.4 ± 0.9; Statistical
This is a naive, purely statistical model. It predicts September mean extent simply from a Gompertz curve representing the trend over previous years. Estimation data are the NSIDC monthly mean extent reports from September 1979 through September 2010. Prediction unchanged from July.
Randles (Public Contribution); 4.3 + 0.8; Statistical
A Gompertz fit of the NSIDC September extent figures is used as a starting point. Linear regression is then used to predict the residual from the Gompertz fit using the residual of the end of July 2011 Cryosphere Today area number from a gompertz fit of end of July area numbers.
Folkerts (Barton Community College) 4.2 ± 0.2; Statistical
The contribution for August is based on simple quadradic fits for the September extent based on July sea ice area, extent, and volume only. The use of only these three sea ice variables is partly a result of these variables being the best predictors towards the end of the melt season. Various single and multiple regression results with r2 > 0.6 suggest that the September extent will be close to, or perhaps below, the minimum value set in 2007. Prediction unchanged from July.
Lindsay and Zhang (University of Washington); 4.1 ± 0.4; Statistical
The best predictor remains the area with less than 1.0 m of ice, with an r2 value of 0.823. Prediction unchanged from July.
Anderson (Norwegian Space Center); 4.1; Statistical
Prediction is based on the relationship between melting and freezing in the Arctic by comparing winter maximum sea ice area with the summer minimum sea ice area. There is a clear indication that in the last few years (2007-2010) the fraction of the winter ice that melts during summer has increased. Thus, if this is considered a new stable regime, the prediction for the minimum sea ice area would be 4.1 based on a 68% reduction in the low 2011 winter ice area during the summer melt season.
Peterson et al. (UK Met Office); 4.0 ± 1.2; Model
This projection is an experimental prediction from the UK Met Office seasonal forecast system, GloSea4 (Arribas et al., 2011). GloSea4 is an ensemble prediction system using the HadGEM3 coupled climate model (Hewitt et al., 2011). A more complete description of the GloSea4 system can be found in the June report and accompanying references. Prediction unchanged from July.
Wadhams (University of Cambridge); 3.96; Heuristic
Estimate is based on recent EM measurements of first year ice thickness merged into probability density functions of ice thickness from recent submarine voyage and subtracting an assumed summer melt of up to 2m.
| Attachment | Size |
|---|---|
| Andersen158.97 KB | 158.97 KB |
| Arbetter et al.98.71 KB | 98.71 KB |
| Beitsch et al.2.1 MB | 2.1 MB |
| Blanchard et al.2.53 MB | 2.53 MB |
| Canadian Ice Service80.46 KB | 80.46 KB |
| Folkerts54.5 KB | 54.5 KB |
| Hamilton172.29 KB | 172.29 KB |
| Kauker et al.271.75 KB | 271.75 KB |
| Liljegren55.84 KB | 55.84 KB |
| Lindsay and Zhang285.42 KB | 285.42 KB |
| Lukovich et al.597.46 KB | 597.46 KB |
| Meier et al.444.99 KB | 444.99 KB |
| Morison and Untersteiner28.33 KB | 28.33 KB |
| Peterson et al.176.99 KB | 176.99 KB |
| Randles232.87 KB | 232.87 KB |
| Shibata et al.455.79 KB | 455.79 KB |
| Stroeve et al.246.76 KB | 246.76 KB |
| Wadhams52.19 KB | 52.19 KB |
| Watts102.54 KB | 102.54 KB |
| Wu et al.38.97 KB | 38.97 KB |
| Zhang147.38 KB | 147.38 KB |
| Ice Melt Graph267.31 KB | 267.31 KB |
| Attachment | Size |
|---|---|
| Gerland et al.178.2 KB | 178.2 KB |
| Gudmandsen459.94 KB | 459.94 KB |
| Howell2.37 MB | 2.37 MB |
| Petrich et al.56.55 KB | 56.55 KB |
| Zhang147.38 KB | 147.38 KB |
 values for September 2010 sea ice extent. Credit: Arctic Research Consortium of the U.S. (ARCUS). Click to enlarge.")