
OVERVIEW
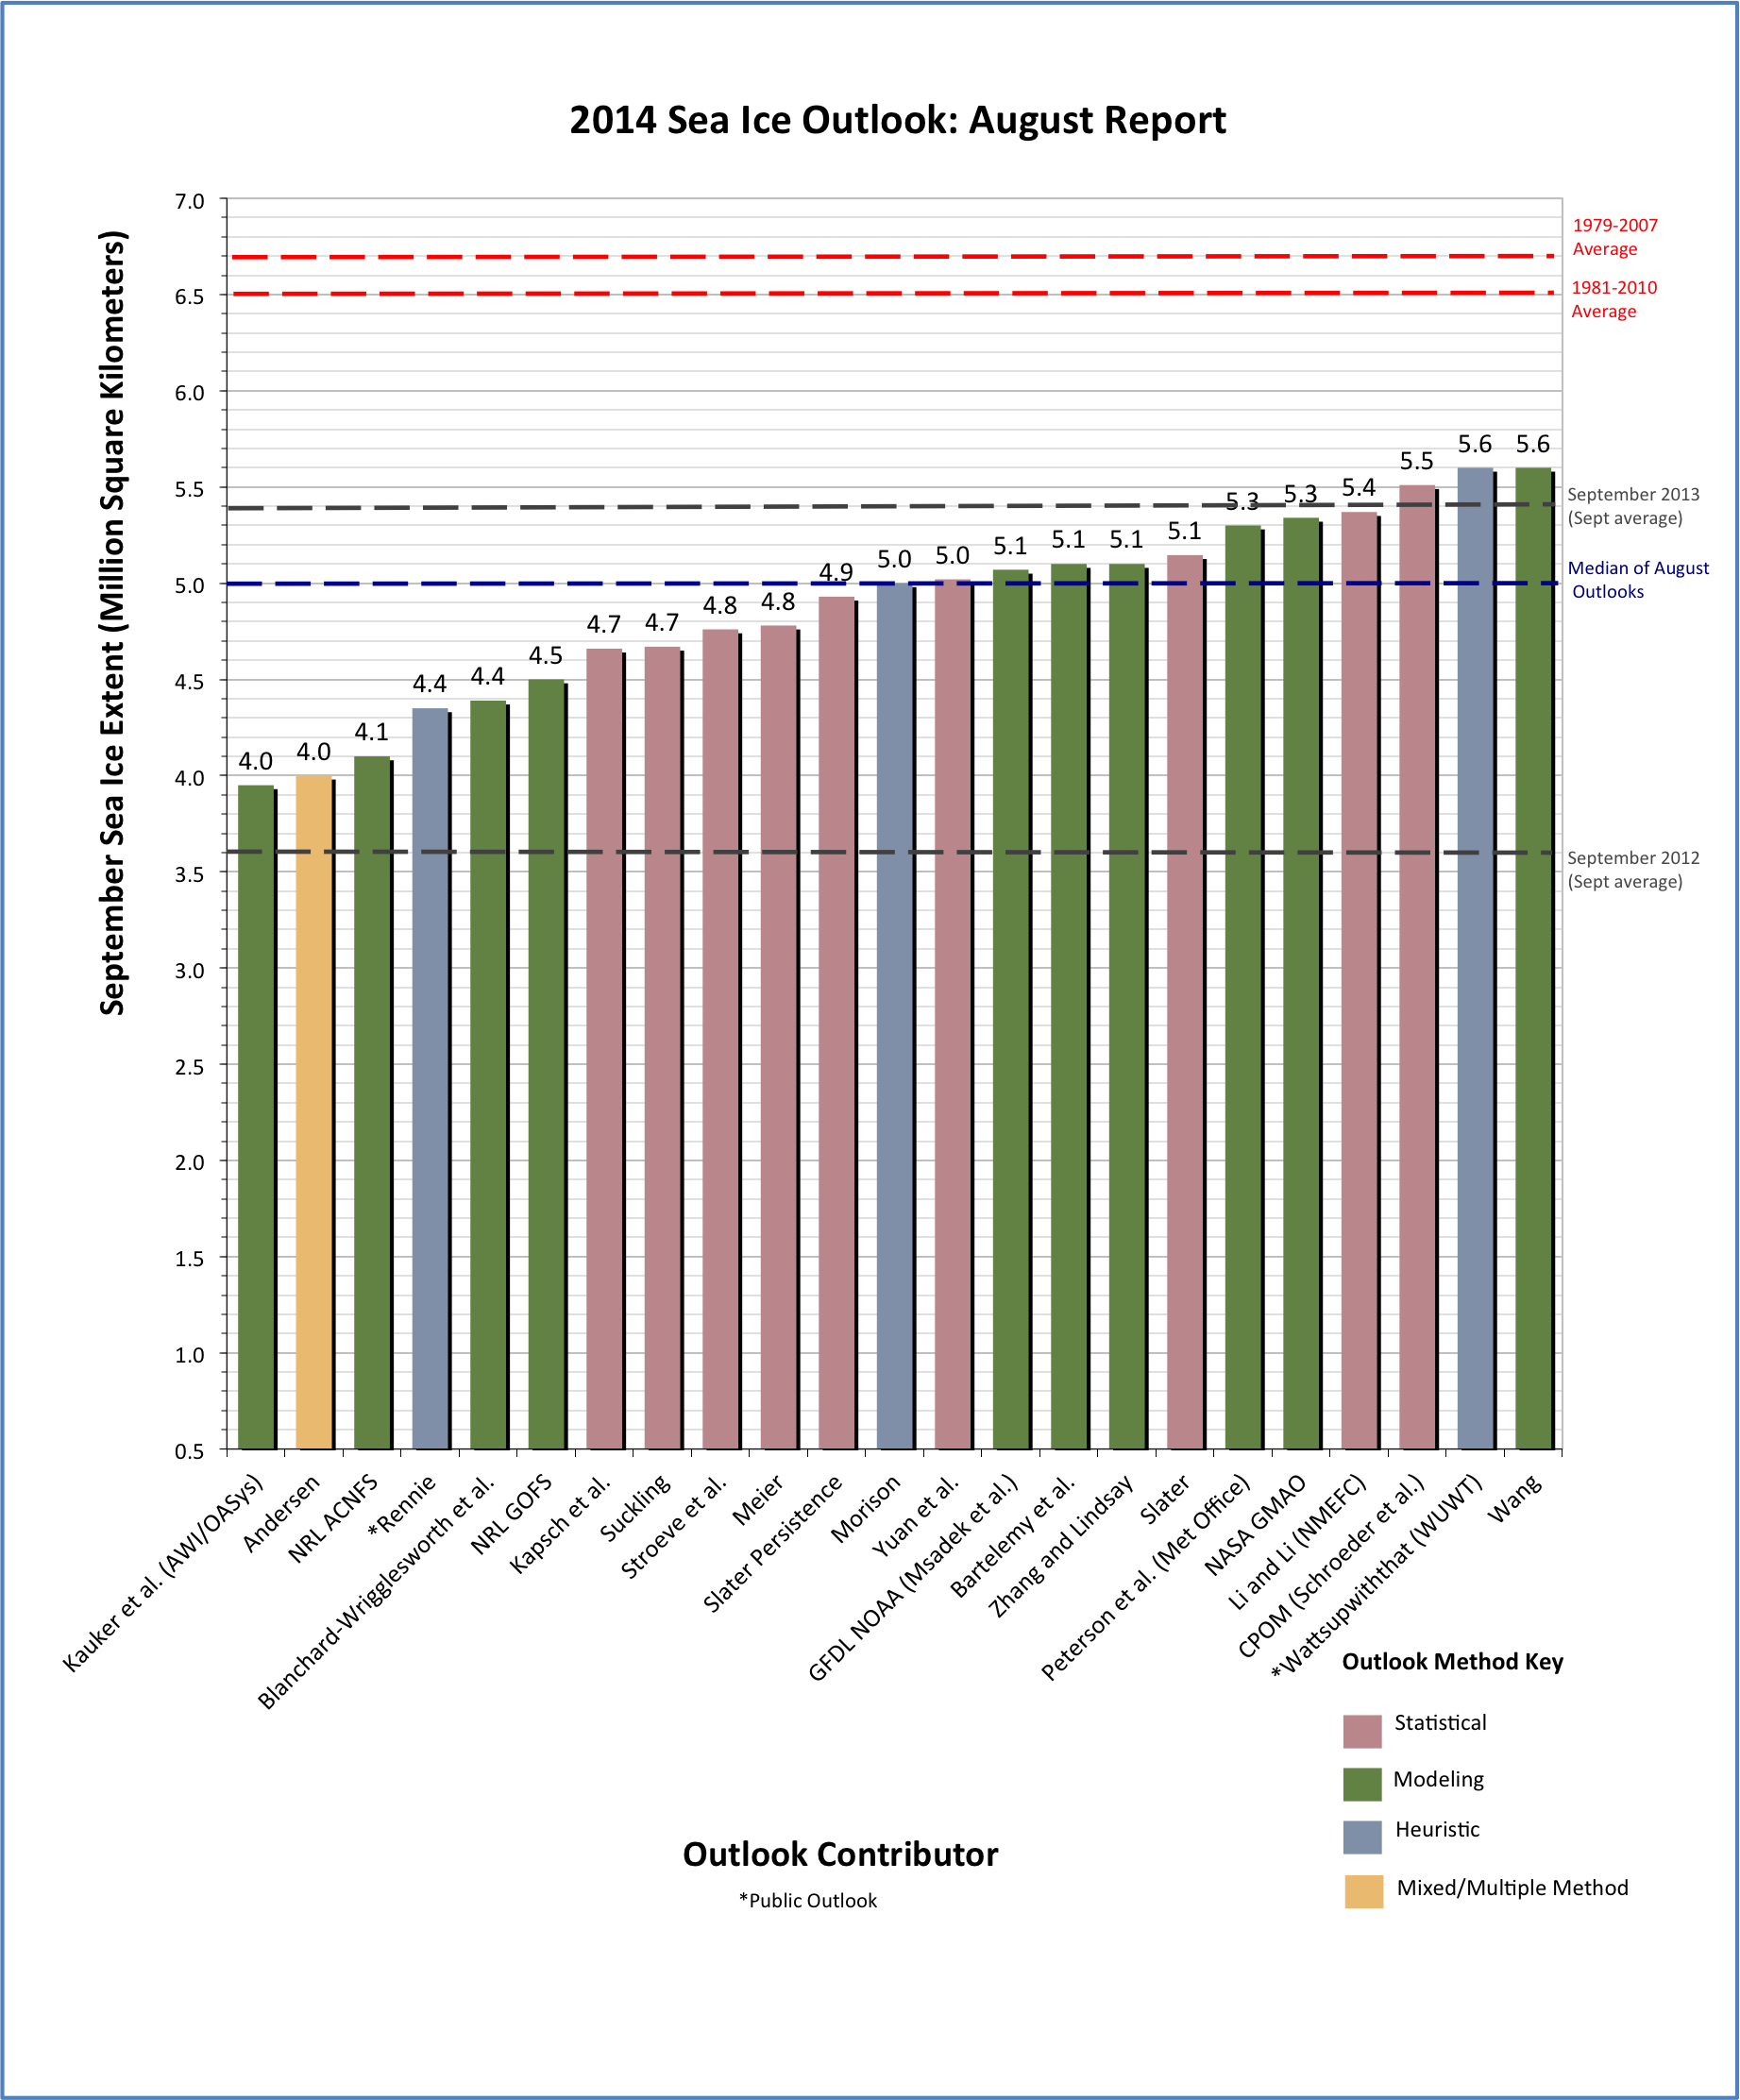
Thank you to the groups that contributed to the August 2014 Outlook. We received 23 pan-Arctic contributions. Of the 23 contributions, some are unchanged from July. The median Outlook value for September extent is 5.0 million square kilometers with a quartile range from 4.58 to 5.22 million square kilometers. The overall range is between 4.0 and 5.6 million square kilometers. The median value for August is increased from the June and July values of 4.7 and 4.8 million square kilometers, respectively. This increase reflects the relatively slower decline in ice extent through August than what had been projected earlier. The overall range has narrowed since July, suggesting that the projections are tending to converge, as one would expect with a shorter forecast period. There were four regional Outlooks submitted with a fairly large range in both spatial extent and ice-free dates. There have not been any significant extreme weather events this summer as was seen during the record low years of 2007 and 2012. The more quiet conditions have likely played a role in the evolution of the sea ice extent this summer. While the extent is far from a record low, all contributions will put 2014 as one of the ten lowest September extents in the 36-year satellite record.
The Sea Ice Outlook is a venue for discussion and networking and provides a transparent exercise in both scientific sea ice predictions as well as estimates from the public. The August report was developed by Walt Meier, NASA Goddard Space Flight Center, and the rest of the Sea Ice Prediction Network (SIPN) leadership team, with a section analyzing the model contributions by Francois Massonnet, Université Catholique de Louvain. The report includes comments on modeling outlooks and on regional predictions, a summary of current conditions, key statements from each Outlook, and links to view or download the full outlook contributions. See the original call for contributions for the August report here. Post-season activities of SIPN will provide more of a scientific analysis of the methodologies, relative performance, etc.
 for September 2014 sea ice extent. Labels on the bar graph are rounded to the tenths for readability. Refer to the Individual Outlooks at the bottom of this report for the full details of individual submissions.")
Download High Resolution Version of Figure 1.
, July (mid), August (right) 2014 Outlook contributions as a series of box plots, broken down by general type of method. The box color depicts contribution method.")
COMMENT ON MODELING CONTRIBUTIONS
Provided by François Massonnet, Université Catholique de Louvain
There were 10 model contributions to the August Sea Ice Outlook. The median predicted September sea ice extent is 5.1 million km² (4.8 and 4.7 million km² for July and June, respectively). From figure 3 below it appears that the uncertainties around individual predictions, when they are updated for this month's report, are systematically smaller than the ones for July, themselves smaller than the ones for June (see the July report). This confirms our July statement that the later the prediction date, the more confident the predictions. In addition, it becomes clear from the figure that the inter-model spread is also reduced as the prediction start dates get closer to the month of September. The range (max-min) of predicted sea ice extent is 1.65 million km² for the August outlook, 2.03 million km² for July, and 2.6 million km² for June.
We can now put the suite of June-July-August predictions into perspective. Leaving aside the possibility of sampling issues (we have to acknowledge that the number of model contributions is small), it is encouraging first to note that the uncertainty relative to both initial conditions/atmospheric forcing are systematically reduced as time goes by. It is also encouraging to see that the inter-model spread shrinks over time. This spread—which although narrows over the season is still fairly large—reflects the uncertainty in model physics, the differences in spatial resolution, and the differences in coupling formulation across models. Unless these nine models share common systematic biases, it is thus expected that the average 2014 September Arctic sea ice extent will be in the range 3.95-5.6 million km², and likely above the trend line (5.1 million km²), a situation similar to 2013.

REGIONAL SEPTEMBER SEA ICE OUTLOOKS: EXTENT PROBABILITY AND ICE-FREE DATE
We received four regional outlook submissions this month, three of which are from modeling groups. Two of the modeling groups, Cullather et al. and Blanchard-Wrigglesworth et al., are taken from the June outlooks. They use the NASA Global Modeling and Assimilation Office (GMAO) and National Center for Atmospheric Research Community Earth System Model (NCAR CESM) models respectively. The third regional modeling submission, Barthélemy et al., uses the ice-ocean Nucleus for European Modeling of the Ocean Louvain-la-Neuve Sea Ice Model (NEMO-LIM3) model and is initialized on 1 August 2014. We also include Slater's persistence-based statistical model outlook of September sea ice extent initialized with a 50-day lead.
September Extent Probability
The following maps show the probability of encountering September sea ice at concentrations greater than 15% (corresponding to ice extent as commonly defined) in a particular grid cell. Maps with a scale of 0 to 1 are equivalent to a scale of 0% to 100%.


There is considerable spread across all four spatial outlooks. Blanchard-Wrigglesworth et al. show significant ice loss in East Siberia/Alaska, yet indicate a high probability of the North East passage being ice-bound. Cullather et al. show more ice north of Alaska and significant open ocean north of the Siberian coastline, including a 100% chance of an open Northern Sea Route. Barthelemy et al. show high probablity of ice in East Siberia, but a small chance of an ice-bound Northern Sea Route (~20%). Slater's statistical model of sea ice probability shows overall higher probabilities of September ice throughout, and captures the melt-out in the Laptev sea.
We also include a September sea ice concentration map from Zhang and Lindsay's August SIO (mean concentration is a slightly different metric to the probability of sea ice extent). Overall it shows similar patterns to Cullather et al. above.

Ice-Free Date (IFD)
These are spatial plots of the date at which the ice concentration at a given location first drops below 15%. The values shown are days of year (July 1 is day 182, August 1 is day 213 and September 1 is day 244). We also show a recent 'climatology' value calculated using mean daily sea ice concentrations for the period 2003-2012 from the National Snow and Ice Data Center (NSIDC), and the IFD values so far in 2014 (up to day 231).


 from NSIDC")
")
To some degree, the ice-free date maps for the Arctic parallel the extent probability maps shown above, with regions of low or zero sea ice extent probabilities having early melt dates. The Mackenzie Delta and the Laptev seas are earliest to melt out in all 3 outlooks, while the East Siberian Sea has late melt out days (or remains completely frozen). Beyond that there are regional differences across models. The Kara Sea remains frozen till late in the summer in Blanchard-Wrigglesworth et al., but melts relatively early in Cullather et al. and Barthelemy et al.'s outlooks. Comparing 2014 with the recent climatology (2003-2012) in observations, the largest departure is the very early melt out in much of the Laptev sea.
In addition to the three modeling regional outlooks, we received one heuristic submission for the Lincoln Sea and Nares Strait by Gudmandsen. The heuristic forecast, based on current ice conditions and the regional temperature history, predicts open water in Kane Basin and Smith Sound. It is expected that the ice flowing through Nares Strait will disintegrate and melt before the south end of the Strait and Baffin Bay. Nares Strait is resolved by most of the models and Blanchart-Wrigglesworth et al, Cullather et al. and Slater et al. all show low probabilities of sea ice in Kane Basin and Smith Sound for September.
CURRENT CONDITIONS
Sea ice declined at a near normal pace during July and then slowed somewhat during early August. Through mid-August, the extent has been tracking close to that of 2013 (Figure 4). With limited time left in the melt season, the 2012 record low will most likely not be reached, though uncertainty remains as to how the remainder of the Arctic melt season will progress.
. From NSIDC Charctic Interactive Sea Ice Graph, http://nsidc.org/arcticseaicenews/charctic-interactive-sea-ice-graph/.")
While total extent at this time this year is similar to that of 2013, the spatial pattern is somewhat different (Figure 5). The overall distribution of ice is similar in both years with more extensive ice in the East Siberian Sea and more open water in the Laptev Sea. This year a notable tongue of open water stretches north from the Laptev Sea to nearly 85° N latitude. A completely open water channel to reach so far north is quite unusual. Another difference is that in 2013 there were areas of decreased concentration north of the Kara and Barents sea; this year, most of the Arctic sea ice prevails at higher concentrations, indicating a more consolidated and possibly thicker ice cover, which is more resilient to melt and retreat. There are areas of low concentration that are vulnerable to further extensive loss. For example, in the Beaufort and Chukchi Seas, NOAA survey flights indicate that the ice near the ice edge in the Chukchi Sea consists of a mix of deformed ice and level ice with melt ponds penetrating all the way through the ice thickness (Figure 6). This ice may extend much further north and is susceptible to rapid retreat and melt, in particular under the influence of fall storms that further fragment the ice cover and enhance ocean to ice heat flow.
 2013 and (right) 2014. From the University of Bremen/PolarView.")
 inside the ice edge looking NW. Note the heavily ponded first-year ice with ponds penetrating through the entire ice thickness.")
While total extent and the general distribution of the ice cover is similar to last year, the atmospheric patterns are quite different. Sea level pressures continued to be predominantly high in the central Arctic through July and early August (Figure 7). This is a pattern similar to the more extensive ice loss years of 2008-2012. In contrast, summer 2013 was characterized by low pressure over the Arctic, similar to 1981-2010 climatological conditions. Overall temperatures in June through mid-July have been near normal over much of the Arctic Ocean region, with somewhat cooler than normal conditions on the Atlantic side, as well as part of the Chukchi Sea.
 and 2013 (bottom). From NCEP/NCAR Reanalysis fields.")
Regionally, ice loss was most rapid in the Eurasian sector. By mid-August, the Laptev Sea was essentially ice-free, while the East Siberian and Kara sea ice also declined substantially in July and August. Sea ice remained more prevalent in the Beaufort and Chukchi seas, though by mid-August, substantial break-up in the Beaufort was apparent in Moderate Resolution Imaging Spectroradiometer (MODIS) imagery (Figure 8). There is very little ice in the East Greenland Sea, a region fed by the outflow of ice through Fram Strait from the Arctic Ocean. The lack of ice suggests changes in winds that move the ice perpendicular to the Fram Strait outlet. In this region, similar conditions were found in 2013, but in 2012 there was a substantial amount of ice along the east coast of Greenland.

KEY STATEMENTS/EXECUTIVE SUMMARIES FROM PAN-ARCTIC OUTLOOKS
The Outlooks are listed below in order of lowest to highest predicted September extent. Extent and uncertainty values are provided below in units of millions of square kilometers unless noted otherwise. The individual outlooks can be downloaded as PDFs at the bottom of this webpage.
Kauker et al (Alfred Wegener Institute [AWI], Ocean Atmosphere Systems [OASys]), 3.95 (±0.39), Modeling
We estimate a monthly mean September sea-ice extent of 3.95 ± 0.39 million km2. This is based on a sea ice-ocean model ensemble run.
Andersen, 4.00 (3.8-4.0), Statistical/Heuristic
No change from June forecast.
The estimate is based on the average years since 2007, adjusted to account for the extent peaks this past spring (short periods where the extent increased).
Naval Research Laboratory, Arctic Cap Nowcast Forecast System [NRL ACNFS], 4.1 (±0.4), Modeling
The ACNFS was run in forward mode without assimilation, initialized with a July 1, 2014 analysis, for ten simulations using archived Navy atmospheric forcing fields from 2004-2013. The mean minimum ice extent in September, averaged across all ensemble members and corrected for forward model bias, is our projected ice extent. The ACNFS outlook for September minimum ice extent is 4.1 Mkm2 ± 0.4 Mkm2.
Rennie (Public), 4.35 (4.0-4.8), Heuristic
July saw a very small drop in extent equivalent to only 40 cm of thickness loss according to the measure I am using. This compares with 47-55 cm in the same period in previous years. This has moved 2014 from the leader at 1.37 cm loss on July 1st to the laggard at 1.77 cm on August 1st. This has led to a drastic upward movement of my prediction.
Starting with the April Pan-Arctic Ice Ocean Modeling and Assimilation System (PIOMAS) volume distribution and the April National Snow and Ice Data Center (NSIDC) average ice extent the estimated extent loss for each 10 cm thickness of ice loss is calculated. This calculation is then correlated with the reported 5 day average NSIDC ice extent loss. The calculation shows that the extent loss is closely correlated with the initial thickness distribution until the end of July.
However the final September average figure is heavily dependent on August weather. The minimum average thickness loss over the past three years is 2.00 meters. This year that melt would result in an extent of around 4.35 M km2. With 1.77 m of melt as of August 1st, a melt of about 2.00m now seems probable.
Blanchard-Wrigglesworth et al, 4.39 (±0.50), Modeling
No change from June forecast.
Our 2014 September sea ice extent forecast is 4.39 ± 0.50 million square kilometers. This is based upon a forecast using the Community Earth System Model (CESM1) model initialized with sea ice anomalies obtained from the PIOMAS model for May for the period 1st May-1st October. The quoted error is obtained from the standard deviation of the ensemble distribution in September.
Naval Research Laboratory, Global Ocean Forecast System [NRL GOFS], 4.5 (±0.3), Modeling
The GOFS 3.1 was run in forecast mode without data assimilation, initialized with a July 1, 2014 analysis, for ten simulations using archived Navy atmospheric forcing fields from 2004-2013. The mean minimum ice extent in September, averaged across all ensemble members and corrected for forward model bias is our projected ice extent. The GOFS 3.1 outlook for September minimum ice extent is 4.5 Mkm2 ± 0.3 Mkm2.
Kapsch et al, 4.66 (±0.59), Statistical
For the prediction of the September sea-ice extent we use a simple linear regression model that is only based on the atmospheric water vapor in spring (April/May). Thereby we assume that the spring atmospheric conditions, more precisely the greenhouse effect associated with the water vapor in the atmospheric column, are important for the seasonal prediction of the September sea-ice extent.
Suckling 4.67 (3.6-5.8), Statistical
No change from June forecast.
A statistical model, known as Dynamic Climatology, is used to make the prediction for September sea ice extent in 2014. The prediction is initialised with the mean of the observed sea ice extent for September 2009-2013 and an ensemble prediction is created simply by adding all of the observed changes in the sea ice extent record from one September to the next over the historical period 1979-2013.
The ensemble members are then transformed into a probabilistic forecast distribution using the kernel dressing approach, in which the parameters of the kernels are determined based on the statistical skill over a set of hindcasts, under cross-validation.
Using this approach the mean (50th percentile) of the forecast distribution suggests a value for sea ice extent of 4.67 Million square Kilometers, with a 5-95th percentile range (3.64, 5.76) and 'likely range' (33-66%) of (4.38, 4.97).
Stroeve et al, 4.76 (3.66-5.66), Statistical
No change from July forecast.
Our July Outlook contribution represents a slight reduction in the predicted September extent from the June Outlook. As before, we use the survival of ice of different ages to statistically predict the 2014 minimum and use the last 5 years of survival rates as a predictor for this summer. This gives an average estimate of 4.76 ± 0.79 106 km2, and a range from the summer with the lowest (2012) and highest (2009) survival rates within the last 5 years of 3.66 106 km2 to 5.25 106 km2.
Meier, 4.78 (±0.34), Statistical
This method uses daily extent change rates to project the 2014 extent on July 31 through the end of September. The daily September extents are averaged to create monthly averages. The prediction uses the years 2007-2013 as the basis for the extent, as more rapid recent rates likely better reflect the potential trajectory of this year's decline. This results in a projection of 4.78 million km2 with a range of 0.34 million km2, based on the standard deviation of the extent rates. This represents an adjustment upward and a narrow range from the July estimate of 4.52 million km2 ± 0.49 million km2.
Updated August 10: Since the beginning of August, the extent decline has been particularly slow. Thus, while the official contribution estimate for August is 4.78 million km2, the slowing trend in the extent decline suggests a higher September extent. Using data from August 10, the estimate for September extent is now 5.11 million km2 ± 0.13 million. A record low this year is deemed to be not possible.
Slater Persistence, 4.93 (±0.39), Statistical
Three different types of persistence forecasting at 50-day or 2 month lead time. The methods contain some skill at this timescale.
Morison, 5.0 (±1.0), Heuristic
My estimate is based on prior year's snow and ice and the Arctic Oscillation index plus in situ observations of ice in April, June, and now July.
Yuan et al, 5.02 (±0.72), Statistical
The Markov model is capable to capture co-variability in the ocean-sea ice–atmosphere system, which is likely the predictable part of variances in sea ice. The model predicts that the Arctic sea ice extent in September 2014 will be 5.02 million square km. Cross-validation skill, measured by the correlation between two-month lead predictions and observations of September ice extent, is 0.82, while the RMS error of predictions is 0.72 million square km.
Geophysical Fluid Dynamics Laboratory [GFDL] NOAA (Msadek et al), 5.07 (4.69-5.63), Modeling
Our prediction for the September-averaged Arctic sea ice extent is 5.07 million square kilometers, with an uncertainty range going between 4.69 and 5.63 million square kilometers. Our estimate is based on the GFDL CM2.1 ensemble forecast system in which both the ocean and atmosphere are initialized on August 1 using a coupled data assimilation system. Our prediction is the bias-corrected ensemble mean, and the given range corresponds to the lowest and highest extents in the 10-member ensemble. Our model predicts that September 2014 Arctic sea ice extent will be 1.45 million square kilometers below the 1981 to 2010 observed average extent, but will not reach values as low as those observed in 2007 or 2012.
Barthélemy et al, 5.1 (4.5-5.6), Modeling
Our estimate is based on results from ensemble runs with the global ocean-sea ice coupled model Nucleus for European Modeling of the Ocean Louvain-la-Neuve Sea Ice Model (NEMO-LIM3). Each member is initialized from a reference run on July 31, 2014, then forced with the National Centers for Environmental Prediction / National Center for Atmospheric Research (NCEP/NCAR) atmospheric reanalysis from one year between 2004 to 2013. Our estimate is the ensemble median, and the given range corresponds to the lowest and highest extents in the ensemble.
Zhang and Lindsay, 5.1 (±0.4), Modeling
Our seasonal prediction focuses not only on the total Arctic sea ice extent and ice concentration field, but also on ice thickness field and ice edge location. We feel that, for all practical and scientific reasons, it is particularly important to improve our ability to predict the ice thickness and the ice edge. The August 1 prediction shows more ice (5.1 ± 0.4 million square kilometers) than the July 1 prediction (4.8 ± 0.4), in both the Pacific and Atlantic sectors.
Slater, 5.146 (±0.35), Statistical
This is my standard 50-day lead time forecast – the mean is derived from averaging the daily values. The model has run operationally throughout the melt season.
Peterson et al (Met Office), 5.3 (±0.6), Modeling
Using the Met Office GloSea5 seasonal forecast systems we have generated a model based mean September sea ice extent outlook of (5.3 ±0.6) x 106 km2. This has been generated using start dates between 22 July and 11 August to generate an ensemble of 42 members centered around 1 August.
Caveat: The ensemble mean forecast is one of many realizations of possible September sea ice extent produced by the seasonal forecast system. Whilst the system is devised to accurately account for the range of possible outcomes, as expressed by our ensemble spread and uncertainty estimate, there is still a possibility of the actual outcome falling outside this estimate.
NASA Global Modeling and Assimilation Office [GMAO], 5.34 (±0.44), Modeling
A projection of 5.34 ± 0.44 million km2 is made from forecasts initialized from 11 April until 1 May. The forecast has been bias corrected to NSIDC Sea Ice Index values over the previous 15-year period. This projection is made in order to understand the relative skill of the forecasting system and to determine the effects of future improvements to the system.
Li and Li (National Marine Environmental Forecasting Center [NMEFC]), 5.37 (4.76-5.97), Statistical
We used a simple statistic method to do the sea ice extent prediction. The sea ice extent of September has a good correlation with the sea ice extent of Jan to Apr of the same year and the extent of September 3 years ago. Combined the multiple regression method and optimal climate normal method, we derived the sea ice extent of September this year is 5.37 million square kilometers.
Centre for Polar Observation and Modelling [CPOM] (Schroeder et al), 5.51 (+/- 0.44), Statistical
No change from July forecast.
We predict the September 2014 ice extent will be 5.5 million km2, close to the level in 2013. The melt-pond area in May and in the beginning of June has been low due to colder air temperatures and thicker ice in the relevant areas of the Arctic compared to the last 5 years.
Watt'sUpWithThat.com (Public), 5.6, Heuristic
Online poll started 8/11/14 running 24 hours. 657 votes were cast on the question "What will the September monthly average Arctic sea ice extent be?"
Wang, 5.6 (±0.25), Modeling
Initialization dates for the August submission were July 29 - August 7.
Gudmandsen (Regional Only), Lincoln Sea and Nares Strait, Heuristic
A heuristic forecast for ice conditions in the Nares Strait region is continued ice free conditions in Kane Basin and Smith Sound. It is expected that ice flowing through Nares Strait will disintegrate and melt before reaching Baffin Bay. There is still the possibility of an ice arch forming north of the strait (similar to 2009) or a large floe blocking one of the passageways for a brief period.
Individual Outlook PDFs
| Attachment | Size |
|---|---|
| Andersen (Same as June)35.96 KB | 35.96 KB |
| Barthélemy et al.450.56 KB | 450.56 KB |
| Blanchard-Wrigglesworth et al. (Same as June)403.87 KB | 403.87 KB |
| GFDL NOAA Msadek et al.199.49 KB | 199.49 KB |
| Kapsch et al.58.56 KB | 58.56 KB |
| Kauker et al.166.1 KB | 166.1 KB |
| Li and Li NMEFC181.78 KB | 181.78 KB |
| Meier542.24 KB | 542.24 KB |
| Morison39.91 KB | 39.91 KB |
| NASA GMAO Cullather et al. (Same as June)2.21 MB | 2.21 MB |
| NRL ACNFS496.9 KB | 496.9 KB |
| NRL GOFS606.68 KB | 606.68 KB |
| Peterson et al. Met Office111.51 KB | 111.51 KB |
| Rennie501.84 KB | 501.84 KB |
| Schroeder et al. (Same as July)48.46 KB | 48.46 KB |
| Slater223.47 KB | 223.47 KB |
| Slater Persistence188.28 KB | 188.28 KB |
| Stroeve et al. (Same as July)205.05 KB | 205.05 KB |
| Suckling (Same as June)107.2 KB | 107.2 KB |
| Wang109.79 KB | 109.79 KB |
| WUWT262.26 KB | 262.26 KB |
| Yuan et al.84.29 KB | 84.29 KB |
| Zhang and Lindsay379.2 KB | 379.2 KB |
| Attachment | Size |
|---|---|
| Barthélemy et al.450.56 KB | 450.56 KB |
| Blanchard-Wrigglesworth et al.355.84 KB | 355.84 KB |
| Gudmandsen237.02 KB | 237.02 KB |
| NASA GMAO Cullather et al. 3.64 MB | 3.64 MB |
 for September 2014 sea ice extent. Labels on the bar graph are rounded to the tenths for readability. Refer to the Individual Outlooks at the bottom of this report for the full details of individual submissions.")