By: Serina Wesen, University of Alaska Fairbanks (UAF); Anika Pinzner, UAF; Matthew Sturm, UAF
Introduction
In spring of 2022, a group of researchers traveled to Utqiaġvik (formerly known as Barrow), Alaska to monitor Arctic snowmelt. During the melt season, the Arctic landscape transitions from reflecting 85% of the sunlight to less than 20%, making this transition an important driver of regional and global climate. The efficiency of a surface to reflect light or radiation back into the atmosphere is called albedo, and it can vary from zero (0) (indicating no reflection) to one (1) (100% reflectivity). In what was our second season of the Snow ALbedo eVOlution (SALVO) project, funded by the US Department of Energy, we monitored both snowmelt patterns and albedo trajectories on two tundra and two sea-ice sites. One of our team's main aims was to understand the role water, substrate, and topography play in driving the rate at which the Arctic snowmelt takes place, as well as the spatial landscape patterns that form during the transition. Our first field season was carried out in 2019, but due to the COVID-19 pandemic, the 2020 and 2021 seasons were postponed, and it was not until this spring that we were able to return.
Investigating snowmelt on both tundra and on sea ice, simultaneously, has allowed us to explore the nature and differences in the melt mechanisms operating in these two environments.
Our Spring 2022's SALVO group included Jennifer Delamere, University of Alaska Fairbanks (UAF); Matthew Sturm, (UAF); Melinda Webster, (UAF); Anika Pinzner, (UAF); Phillip Wilson, (UAF); Ema Mayo, (UAF); Serina Wesen, (UAF); Hannah Chapman-Dutton, (UAF); Owen Larson, (UAF); David Clemens-Sewall (Dartmouth College); and David Shean (University of Washington).
Study Site
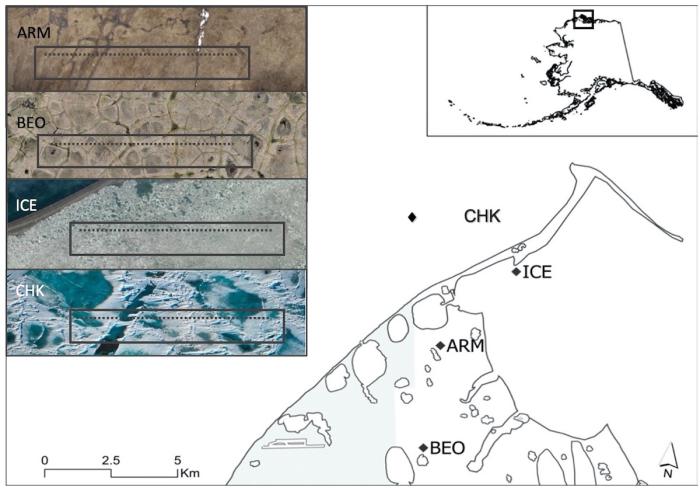
Before the melt had begun, our team installed the four sample sites shown in Figure 1. The sea-ice sites were set up on the smooth sea ice of Elson Lagoon (ICE) and the rough shorefast ice on the Chukchi Sea (CHK). The two tundra sites included gently sloping terrain (ARM) as well as flat terrain mostly comprising low-centered polygons (BEO).
Data Collection
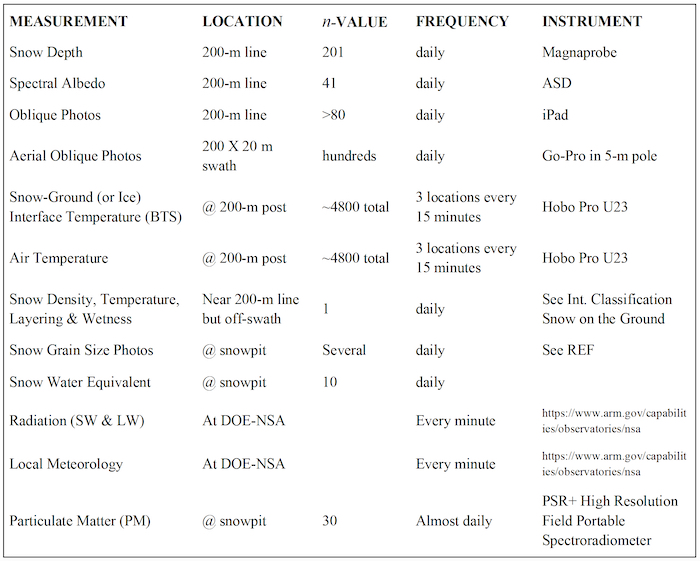
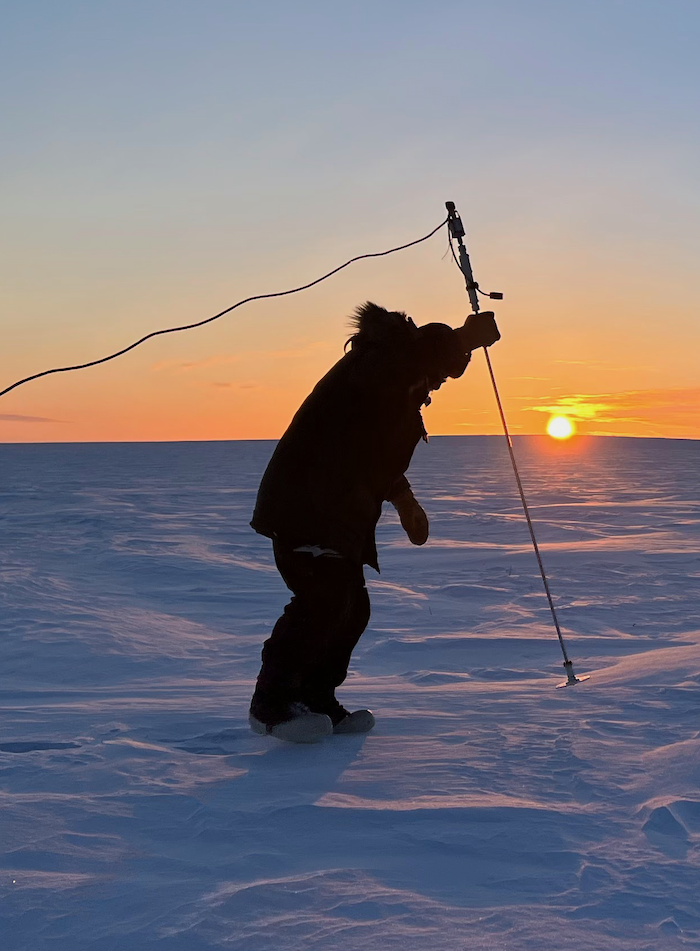
At each site, we set up a 200-meter baseline oriented roughly east-west. Along this line we took detailed snowmelt and albedo measurements on a near-daily basis. We started the measurements in April before the snow was melting and continued them until the snow was gone in late June. Each day we used a range of ground and aerial methods to measure snowmelt, albedo, and related characteristics (Figure 2). We also dug and measured many snow pits every day to understand snow densities, layers, grain sizes, impurities, and wet snow.
Complex Melt Mechanisms
One might ask, "What could possibly be new that we need to learn about melting snow?" Humans have been watching snow melt since the Ice Age or longer. Surprisingly, we did see new things, and the comparison of snow melting on tundra vs. sea ice helped us make these key observations.
First, we observed that the melt took place in four distinct phases:
The first, or pre-melt phase, which we observed in April showed that the cumulative set of winter processes that produced the wind-blown tundra snow mattered a great deal in how the snow would melt come May.
The second phase, which took place while there was still 100% snow cover, was similar at all four sites. During this phase—which mainly consisted of a slow lowering of the albedo due to snow grain coarsening—the snow depth and its coverage changed very little.
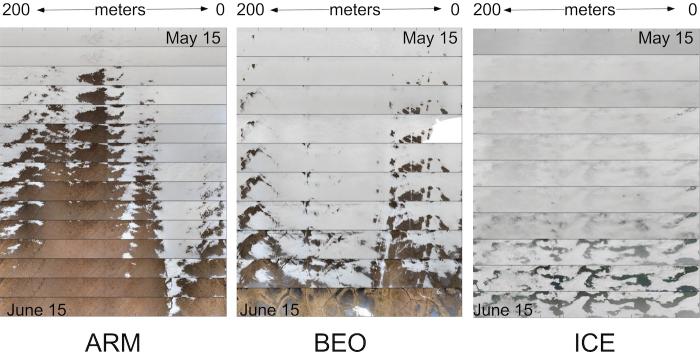
and 4. It was during the third and fourth phases that we saw new (or at least not widely noted) melt processes. There was significant development of internal and basal ice features within the snowpack, and where and how many of these formed played a significant role in how fast the melt went later. Also, the nature of the substrate under the snow (tundra or ice; smooth or rough) played a large role in determining where these ice features formed. That, in turn, affected the overall speed of the melt where the sloping tundra site melted out several weeks earlier than the sea-ice sites (Figure 4), despite being near the other sites, having the same weather conditions, and starting with much the same amount of snow initially.
Second, we realized that what lies under the snow (be it tundra or ice), and the microtopographic nature of that substrate, substantially impacts how the snowmelt will take place. This realization is consistent with some new thinking in hillslope hydrology called "fill and spill."
Why Snowmelt Processes Matter
The slowing down, or speeding up, of snowmelt by even a few weeks matters. Arctic snowmelt occurs near the solar maximum of the season, very close to the summer solstice on 21 June. Shifting when the melt begins, and how long it takes, has a direct impact on the overall annual heating in the Arctic. We need to understand how the albedo transition happens, and how it might be altered in the future due to a warming climate. We don't know how changes in climate will affect future melt patterns or trends, but we do know now that these melt patterns can have a large effect on regional and global climate systems. While the very late spring melt of 2022 seems to suggest some sort of climate cooling, we would like to remind readers that climate change is definitely underway in the Arctic and is likely to be enhanced by changes in the way and speed at which the snow melts.
The SALVO team will return to Utqiaġvik for one more season of fieldwork to monitor the spring 2023 melt.
Further information is available on the US Department of Energy's Atmospheric Radiation Measurement (ARM) SALVO Research page and in the related news article, "ARM snow albedo campaign resumes in Alaska after pandemic postponement". Or contact smwesen [at] alaska.edu (Serina Wesen), apinzner [at] alaska.edu (Anika Pinzner), and msturm1 [at] alaska.edu (Matthew Sturm).
See also a poster summarizing the project, Spatial Evolution of Snowmelt on the Arctic Coast: A field Campaign in Utqiaġvik, Alaska.
Funding
SALVO is funded by the US Department of Energy's Atmospheric Radiation Measurement (ARM) user facility and Atmospheric System Research (ASR) program. The work was conducted under DoE-ASR Grant DE-SC00190. Thank you to UIC Science in Utqiaġvik for providing additional logistical support.
Land acknowledgement
We would like to recognize that our field sites were located on traditional Iñupiat land and would not have been able to be completed without the generous support of the local community in Utqiaġvik.
References
Pinzner, A., P. Wilson, M. Sturm, J. Delamere, D. Perovich, E. Mayo, C. Parr, T. Grams. 2020. Spatial Evolution of Snowmelt on the Arctic Coast: A Field Campaign in Arctic Alaska. Poster, 2020 American Geophysical Union Fall Meeting.
About the Authors
 Serina Wesen is the Education & Outreach Designer with the Snow, Ice, and Permafrost Group at the University of Alaska Fairbanks' Geophysical Institute. She works on an outreach project called "Our Winter World" where snow is used as a mechanism for STEM learning and helped with the SALVO field campaign throughout spring and summer 2022.
 apinzner [at] alaska.edu (Anika Pinzner) is a Geoscience PhD student at the Geophysical Institute's Snow, Ice, and Permafrost Group at the University of Alaska Fairbanks. Her research focuses on snowmelt and albedo trajectories. Anika has been a part of the SALVO project since 2019.
 Matthew Sturm is a snow physicist who has been working in Alaska since 1973. In addition to his many technical papers, he is author of "Field Guide to Snow", a book that explains how snow works in simple terms.

