This article is adapted from the 2018: Sea Ice Outlook Interim Post-Season Report developed by Walt Meier, National Snow and Ice Data Center; Uma Bhatt, University of Alaska, Geophysical Institute; Rick Thoman, Alaska Center for Climate Assessment and Policy; John Walsh, International Arctic Research Center; Edward Blanchard-Wrigglesworth, University of Washington, Department of Atmospheric Sciences; Nicholas Wayand, University of Washington, Department of Atmospheric Sciences; Bruce Wallin, University of Colorado, Boulder, NSIDC; and members of the SIPN2 Leadership Team.
The annual Sea Ice Outlook (SIO), an effort of the Sea Ice Prediction Network–Phase 2 (SIPN2), provides an open process for those interested in Arctic sea ice to share ideas about the September minimum sea ice extent. The SIO reports in June, July, and August contain a variety of perspectives on Arctic sea ice—from observations of current conditions, to advanced numerical models, to qualitative perspectives from citizen scientists. Post-season reports provide in-depth analyses of factors driving sea ice, as well as explore the scientific methods for predicting seasonal ice extent. Below are highlights from the SIO 2018 Interim Post-Season Report, published on 11 October.
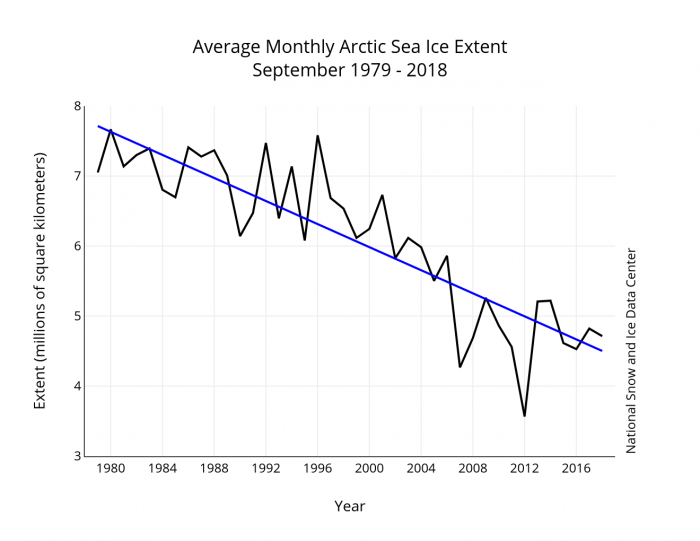
The 2018 Arctic summer melt season officially ended on 14 September. Based on the National Snow and Ice Data Center (NSIDC) Sea Ice Index (SII), the September monthly averaged sea ice extent was 4.71 million square kilometers. This ranks as effectively tied with 2008 for the 6th lowest in the satellite record that began in 1979. The average monthly sea ice extent for September has trended down by 82,300 square kilometers per year (12.8 % per decade, relative to the 1981–2010 average) (See Figure 1).
The 2018 annual minimum extent, which is based on a five-day running average, was 4.59 million square kilometers according to the SII. This metric was also tied with both 2008 and 2010 as the 6th lowest minimum in the satellite record. The minimum extent for 2018 was reached twice, on 19 and 23 September—23 September tied with 1997 for the latest minimum in the satellite record.


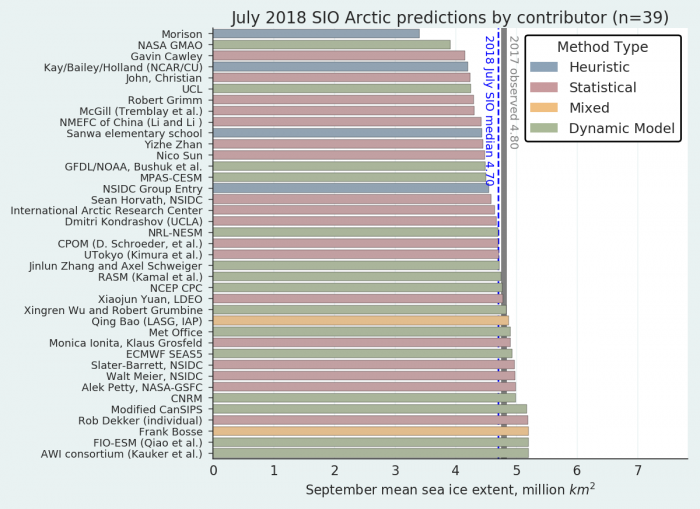
The medians of the Outlook contributions for June, July (Figure 2), and August were 4.60, 4.70, and 4.57 million square kilometers, respectively. Thus, the July ensemble Outlook was nearly perfect in terms of total extent. The August median projection was lower than the observed September extent; this was likely due to an above average rate of ice loss during July, which caused contributors to revise their projections downward. However, the August rate of decline was near average, causing the observed September extent to diverge from the August projection.
The 2018 Arctic weather patterns during the summer months are of interest. Air temperature patterns were above average during the summer of 2018 over the Arctic Ocean and over Eurasia, and were below average over coastal North America. Anomalously low patterns were observed over the central Arctic Ocean, North America, and the Atlantic sector of the Arctic. Temperatures in 2018 rank as the 6th warmest over the 1979–2018 period.
Seasonal anomalies for sea level pressure (SLP) in 2018 followed different patterns from recent years. During 2016 and 2017 the June-August SLP pattern of anomalously low pressure was centered over the Arctic Ocean, whereas in 2018 there were dual low-pressure centers, one in the Barents Sea and one closer to the Canadian Arctic. Seasonal SLP for 2018 ranked at the 3rd lowest pressure and was lower than the past two years.
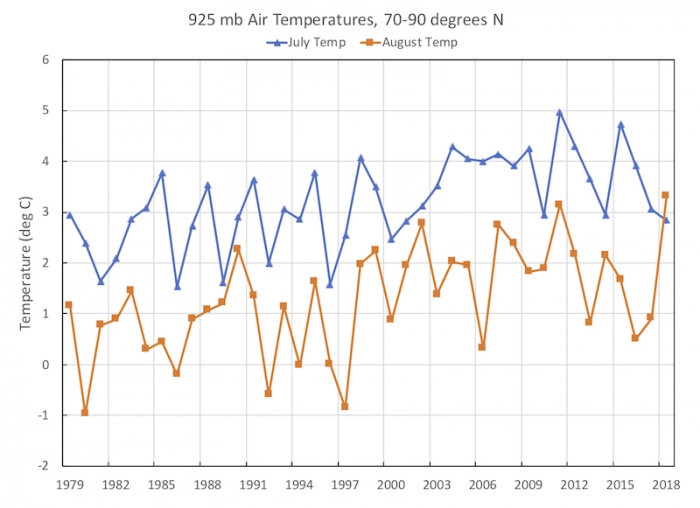
One interesting feature of the summer was the variability between months. July was a cool month, while June and particularly August were warm. In fact, August 925 millibar (mb) temperatures were actually higher than July. That pattern has not been seen in the past 40 years (See Figure 3). Despite the summer variability and the warm August, given that the atmospheric seasonal temperatures were overall warm but not extreme, they are broadly consistent with the ranking of sixth lowest sea ice minimum in 2018.

For further information, please read the complete 2018: Interim Post-Season Report.
References
Fetterer, F., K. Knowles, W. Meier, M. Savoie, and A. K. Windnagel. 2017, updated daily. Sea Ice Index, Version 3. Boulder, Colorado USA. NSIDC: National Snow and Ice Data Center. doi: https://doi.org/10.7265/N5K072F8.
Meier, W., U. S. Bhatt, J. Walsh, E. Blanchard-Wrigglesworth, N. Wayand, R. Thoman, F. Massonnet, J. Zhang, W, M. Serreze, J. Stroeve, L. C. Hamilton, C. M. Bitz, J. E. Overland, H. Eicken, H. V. Wiggins, M. Wang, P. Bieniek, J. Little, J. Kurths, M. Steele, E. Hunke, T. Jung, and B. Wallin. Editors: Turner-Bogren, B., H. V. Wiggins and S. Stoudt. October 2018. "2018 Sea Ice Outlook Interim Post-Season Report." Published online at: https://www.arcus.org/sipn/sea-ice-outlook/2018/interim.
