By Torge Martin, Polar Science Center, Applied Physics Laboratory, University of Washington, now at GEOMAR Helmholtz Centre for Ocean Research Kiel, Kiel, Germany; Michael Steele, Polar Science Center, Applied Physics Laboratory, University of Washington; and Jinlun Zhang, Polar Science Center, Applied Physics Laboratory, University of Washington
Over the past decades arctic sea ice thickness and extent shrank dramatically, which has gained major scientific and public attention. Sea ice inhibits the exchange of heat, moisture, and gases between the atmosphere and the ocean. Our NSF funded project "InMotion: Influx of Momentum into the Arctic Ocean--Changes Associated with Sea Ice Reduction" was designed to investigate how a changing sea ice cover affects the amount of wind energy entering the Arctic Ocean.

In the Arctic, wind is the dominant driver of sea ice and ocean motion. The momentum flux from the atmosphere into the ocean (also known as ocean surface stress) depends on various factors such as wind speed, surface layer stability, surface roughness, and sea ice conditions. Roughness changes in response to changing ocean surface waves and variations in the geometry of ice floes and ridges. Three regimes characterize how sea ice moderates momentum transfer into the Arctic Ocean:
- At very high ice concentrations, near 100%, the pack ice is so compact that it barely responds to the wind forcing and hence also shields the ocean from the wind.
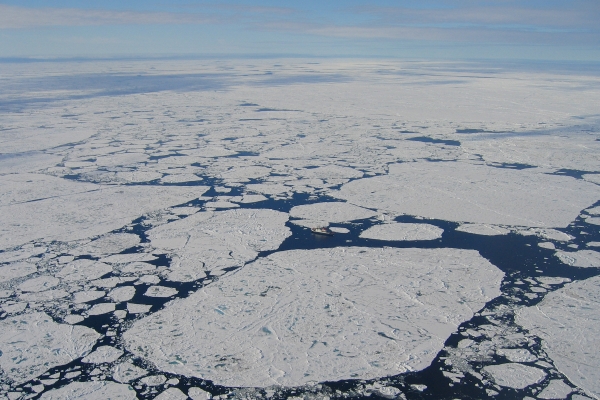
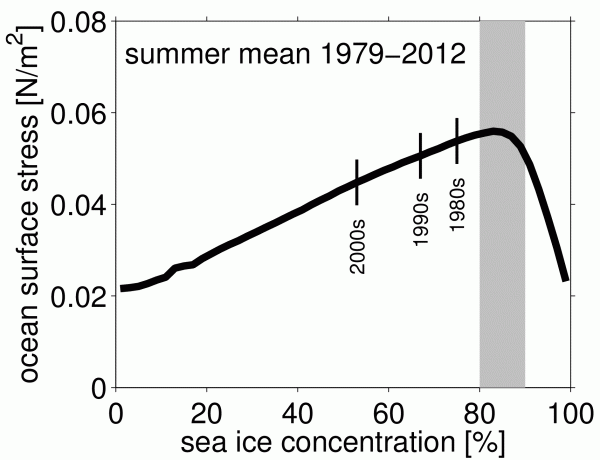
- Slightly lower ice concentrations, about 80-90%, allow the ice to drift freely with the wind as pressure within the ice pack is reduced to a minimum, while floe edges and ridges provide high drag (See Figure 1). We refer to this as an "optimal ice concentration", because ocean surface stress is maximal in this case -- as illustrated in the graph of ocean surface stress as a function of sea ice concentration derived from Pan-Arctic Ice Ocean Modeling and Assimilation System1(PIOMAS) output (See Figure 2).
- For still lower ice concentrations, stresses decline because open water—even with surface waves—is generally smoother than pack ice.

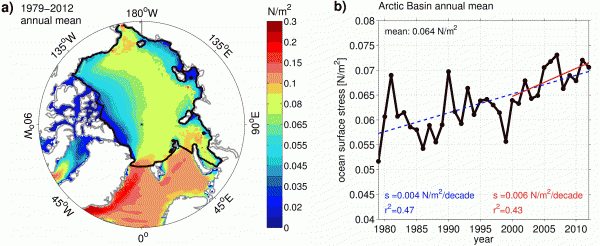
Our PIOMAS simulation enables us to create a map of annual mean Arctic-wide ocean surface stress (See Figure 3a). Stress is high where wind forcing is strong and the ice cover generally less compact, such as in the Nordic and Barents Seas. Stress is low where the pack ice is thick and dense (e.g., north of Greenland) or where there is rigid winter landfast ice (e.g. along the Siberian coast). A belt of moderate ocean stress lies between these two regions.

Annual mean ocean surface stress over the Arctic Ocean is increasing with a recent steepening of the trend (See Figure 3b). Since there is no significant increase in the wind forcing—i.e. the source of momentum—over the same period (Kwok et al., 2013) we link this increase entirely to the decrease in sea ice thickness. A thinner and thus weaker ice cover has less resistive force against the wind forcing, and hence enables greater momentum transfer into the ocean.
On the other hand, we found that a shrinking summer sea ice extent means less momentum flux into the ocean in this season. How is that? In the 1980s and 1990s most of the Arctic Ocean featured high ice concentrations, even in summer, with an average close to the 80-90% optimum (See Figure 2). In recent years however, vast areas of open water have reduced the mean ice concentration below this optimum, which results in an overall ocean stress decrease at a small but significant rate in summer.
What does the future hold? The area of high momentum flux (See green in Figure 3a) is shrinking toward Greenland as sea ice continues to retreat. Further, an expanding summer season with increasingly less ice coverage might steepen the negative ocean stress trend and eventually even reverse the positive trends in spring and fall. But this assumes that wind forcing and ocean surface waves do not grow, an assumption that might prove incorrect in a changing climate. This illustrates the fascinating interplay between opposing forces that will determine the magnitude of Arctic Ocean currents in the future.
More details on our study, ocean surface stress seasonality and trends, and the optimal ice concentration can be found in Martin et al. (2014). Daily fields of ocean surface stress from 1979 to 2012 based in ourPIOMAS simulation can be found on the ACADIS InMotion page. For more information, please contact Torge Martin (torge.martin [at] gmail.com).
1 We ran PIOMAS for the period 1979 to 2012 forced by atmospheric fields of the NCEP/NCAR reanalysis (Kalnay et al., 1996) and restrained by the satellite-observed sea ice edge provided by the NSIDC (Nolin et al., 1998).
References
Kalnay, E., M. Kanamitsu, R. Kistler, W. Collins, D. Deaven, L. Gandin, M. Iredell, S.Saha, G. White, and J. Woollen, 1996. The NCEP/NCAR 40-year reanalysis project, Bulletin of the American Meteorological Society,77(3), 437-471.
Kwok, R., G. Spreen, and S. Pang, 2013. Arctic sea ice circulation and drift speed: Decadal trends and ocean currents, Journal of Geophysical Research, doi:10.1002/jgrc.20191.
Martin, T., M. Steele, and J. Zhang (2014), Seasonality and long-term trend of Arctic Ocean surface stress in a model, Journal of Geophysical Research: Oceans, 119(3), 1723-1738, doi:10.1002/2013JC009425.
Nolin, A., R. L. Armstrong, and J. Maslanik (1998), Near-Real-Time SSM/I-SSMIS EASE-Grid Daily Global Ice Concentration and Snow Extent, Digital Media, NationalSnow and Ice Data Center, Boulder, Colo.
 Torge Martin is a meteorologist and sea ice physicist who is particularly interested in atmosphere-ice-ocean interaction. He is running and advancing numerical models to improve the understanding of complex mechanisms in the climate system. After spending two and a half years at the Polar Science Center in Seattle he recently moved back to GEOMAR in Kiel, Germany where he continues to work with modelers and observationalists on the role of the polar oceans in global climate change.
 Michael Steele is a physical oceanographer at the Polar Science Center, Applied Physics Lab, University of Washington. His focus is on the sea ice and upper ocean of the arctic seas, using in situ and satellite data, as well as numerical model output. His UpTempO buoy project collects upper ocean temperature profiles in open water and under sea ice with hourly resolution, with the purpose of better understanding the seasonal ocean warming and cooling that happens in response to sea ice loss.
 Jinlun Zhang earned his PhD in sea ice and ocean dynamics in 1993 at the Thayer School of Engineering, Dartmouth College. Currently a senior principal oceanographer at the Polar Science Center, Applied Physics Laboratory, University of Washington, he investigates changes in polar climate using sea ice and ocean modeling and assimilation systems. He also studies the impact of changes in Arctic sea ice on marine planktonic ecosystems.
