
Assessment of Current Ice Conditions Relevant to Distribution and Access of Walrus
State of the Ice at Season’s Start
Contributed by Matthew Druckenmiller (National Snow and Ice Data Center and SEARCH Sea Ice Action Team) & Hajo Eicken (University of Alaska Fairbanks)
This past winter in the northern Bering Sea region, as well as across Alaska, was dominated by very cold temperatures. This cold period began in mid-December 2019 and continued through mid-March 2020. Figure 1 shows these unusually cold temperatures at Nome, Alaska. Aside from a relatively warm period in mid-January and a few days in February, temperature extremes frequently reached more than 15–20°F colder than average, with a couple days more than 25°F colder than average. These frigid temperatures brought back the sense of a “real-winter” and worked to thicken sea ice across the region. This thickening helped to stabilize shorefast ice and to overall build an ice cover more resistant to storms.
")
The Chukchi Sea continued along the trend of the last two decades toward an increasingly later fall freeze-up in December. Similarly, ice coverage in the Bering Sea was well below normal throughout December. However, by early January, a rapid ice advance quickly brought ice coverage across the Bering Sea to just below normal conditions throughout much of January. From early February through mid-March, ice in the Bering Sea actually experienced above average ice coverage (see Figure 2). For example, in mid-February, all of Norton Sound was ice covered. This was in stark contrast to what communities across the region experienced during winters 2018 and 2019.
. Courtesy of the Alaska Center for Climate Assessment and Policy, UAF. (Data Source: NSIDC Sea Ice Index, Version 3; Last updated: 28 March 2020)")
In mid-March, sea ice across the Bering Sea steeply declined by over 35% in coverage. This period of ice retreat happened at the same time as the region experienced a shift to higher temperatures. Figure 1 shows temperatures at Nome for this period as 10–15°F warmer than normal. While this retreat was significant overall, it did not substantially change ice coverage in the northern Bering Sea. Using MODIS satellite imagery, Figure 3 compares ice conditions between late March/early April for the last three years. At this time in 2020, most of the northern Bering Sea is ice covered, with some open water stretches on the northern sides of St. Lawrence Island and the Seward Peninsula, due to prevailing south winds that set in during the past several days (31 March–3 April).
 observed using MODIS satellite imagery. (Source: Imagery obtained from NASA Worldview)")
The passage of a series of low-pressure systems associated with strong storms in the Chukchi Sea beginning in mid-March helped drive up air temperatures. These storms also created ice pressure ridges in coastal regions that may have helped stabilize shorefast ice. Such a grounded ice pressure ridge is visible in satellite imagery shown in Figures 3 and 4, extending out from Cape Prince of Wales into the water of the northern Bering Strait towards Shishmaref.
")
Overall, shorefast ice has maintained a more typical (yet still variable) presence across the region in winter and early spring 2020, especially in contrast to the lack of shorefast ice in 2018 and 2019. Figure 4 highlights shorefast ice near communities that has mostly been in place for at least the last several weeks. While the degree of grounding is not clear, extensive shelves are extending out from the Port Clarence spit and along the southern edge of Norton Sound. One very notable difference between the 2020 and the previous two years is that Kotzebue Sound this year has remained blanketed by mostly undisturbed ice cover throughout winter (see Figure 3), indicating that the cold-driven thickening of the ice earlier in the year has added to its stability. Shorefast ice along the north slide of St. Lawrence Island has been quite variable throughout February and March. Figure 5 shows the current extent of shorefast ice around the island as of 2 April.
")
Weekly Outlook
Click the name of each community below to view more frequently updated and detailed information from the National Weather Service.
Synopsis High pressure is currently over the Bering Sea. On Thursday, a weak low moves into the Bering Sea from the west, losing strength quickly. Friday, a storm force low moves into the western Bering Sea moving slowly to the east through the weekend.
Near St. Lawrence Island
Satellite imagery shows that shorefast ice extends 1 to 6 miles from the north side of the island. A polynya has formed north of the shorefast ice, extending 2 to 10 miles beyond the shorefast ice. Otherwise, very close pack ice consisting of big to giant floes surrounds St. Lawrence Island.
Nome
Sea ice is shorefast from 1 to 6 miles from the Nome to Cape Rodney coastline, then compact pack ice covers the rest of the surrounding area.
Brevig Mission/Port Clarence Area
Shorefast ice extends approximately 18 miles to the west of Brevig Mission, with compact pack ice covering the rest of the surrounding area.
Wales to Shishmaref
The shorefast ice extent along the coast varies from a half mile from Mugisitokiwik to Ikpek, then 2 to 6 miles from Ikpek to Espenberg as well as near Wales. A couple small polynyas have formed between Mugisitokiwik and Ikpek as well as to the northeast of Shishmaref, and they extend up to 13 miles from the shorefast ice. Otherwise, consolidated pack consisting of big to giant floes covers the rest of the surrounding area.
Little Diomede
Sea ice is shorefast between Little Diomede and Big Diomede Island. A polynya has formed from the north end of Little Diomede to approximately 7 miles north as well as a polynya that has formed to the northeast of Wales. Otherwise, consolidated ice surrounds Diomede.
Forecast Discussion
Ice Forecast
During the period of southerly winds, the polynyas that have formed on the north side will expand, and sea ice will continue to compact against the south-facing coastlines. As winds shift to westerly to northerly, sea ice will begin to move southward, filling in any existing polynyas. New polynya formation on the south side of coastlines will occur, but will likely quickly re-freeze as colder air moves in.

Wind Synopsis
On Friday, April 3rd (11–17 mph) southeast winds will increase to 20–30 kt (23–35 mph) and shift to the southwest Friday night. Winds will diminish some by Saturday afternoon April 4th. Winds will rapidly increase again Saturday night and become westerly 25–35 kt (30–40 mph) by Sunday, April 5th. Winds will shift to the west-northwest Sunday night and diminish to 10–15 kt (11–17 mph) on Monday, April 6th. On Tuesday, April 7th, winds will become south 5–10 kt (6–11 mph) and increase to 10–15 kt (11–17 mph) on Wednesday, April 8th. South winds will 10–20 kt (11–23 mph) on Thursday, April 9th, shifting to the east by Friday, April 10th.
Temperature Trend
High temperatures will generally be in the upper 20's to lower 30's on Friday, April 3rd and Saturday, April 4th, with low temperatures in the 20's. A cooling trend will begin on Sunday, April 5th with high temperatures falling to the 20's and low temperatures in the teens. Temperatures will continue to cool Monday, April 6th and Tuesday, April 7th, with highs mainly in the teens, with lows in the single digits. Warmer temperatures are expected Wednesday, April 8th through Friday, April 10th with high temperatures in the 20's to near 30 and lows in the teens to lower 20s.
Daily Weather, Wind, and Temperature Updates
The National Weather Service provides twice-daily, text only updates on the weather, wind, and temperature conditions in specific geographical zones. An interactive weather map for access to other Alaskan zones can be found here: http://weather.gov/anchorage/ice
Wind maps are updated daily and can be viewed here: http://www.weather.gov/afg/SIWO_overview
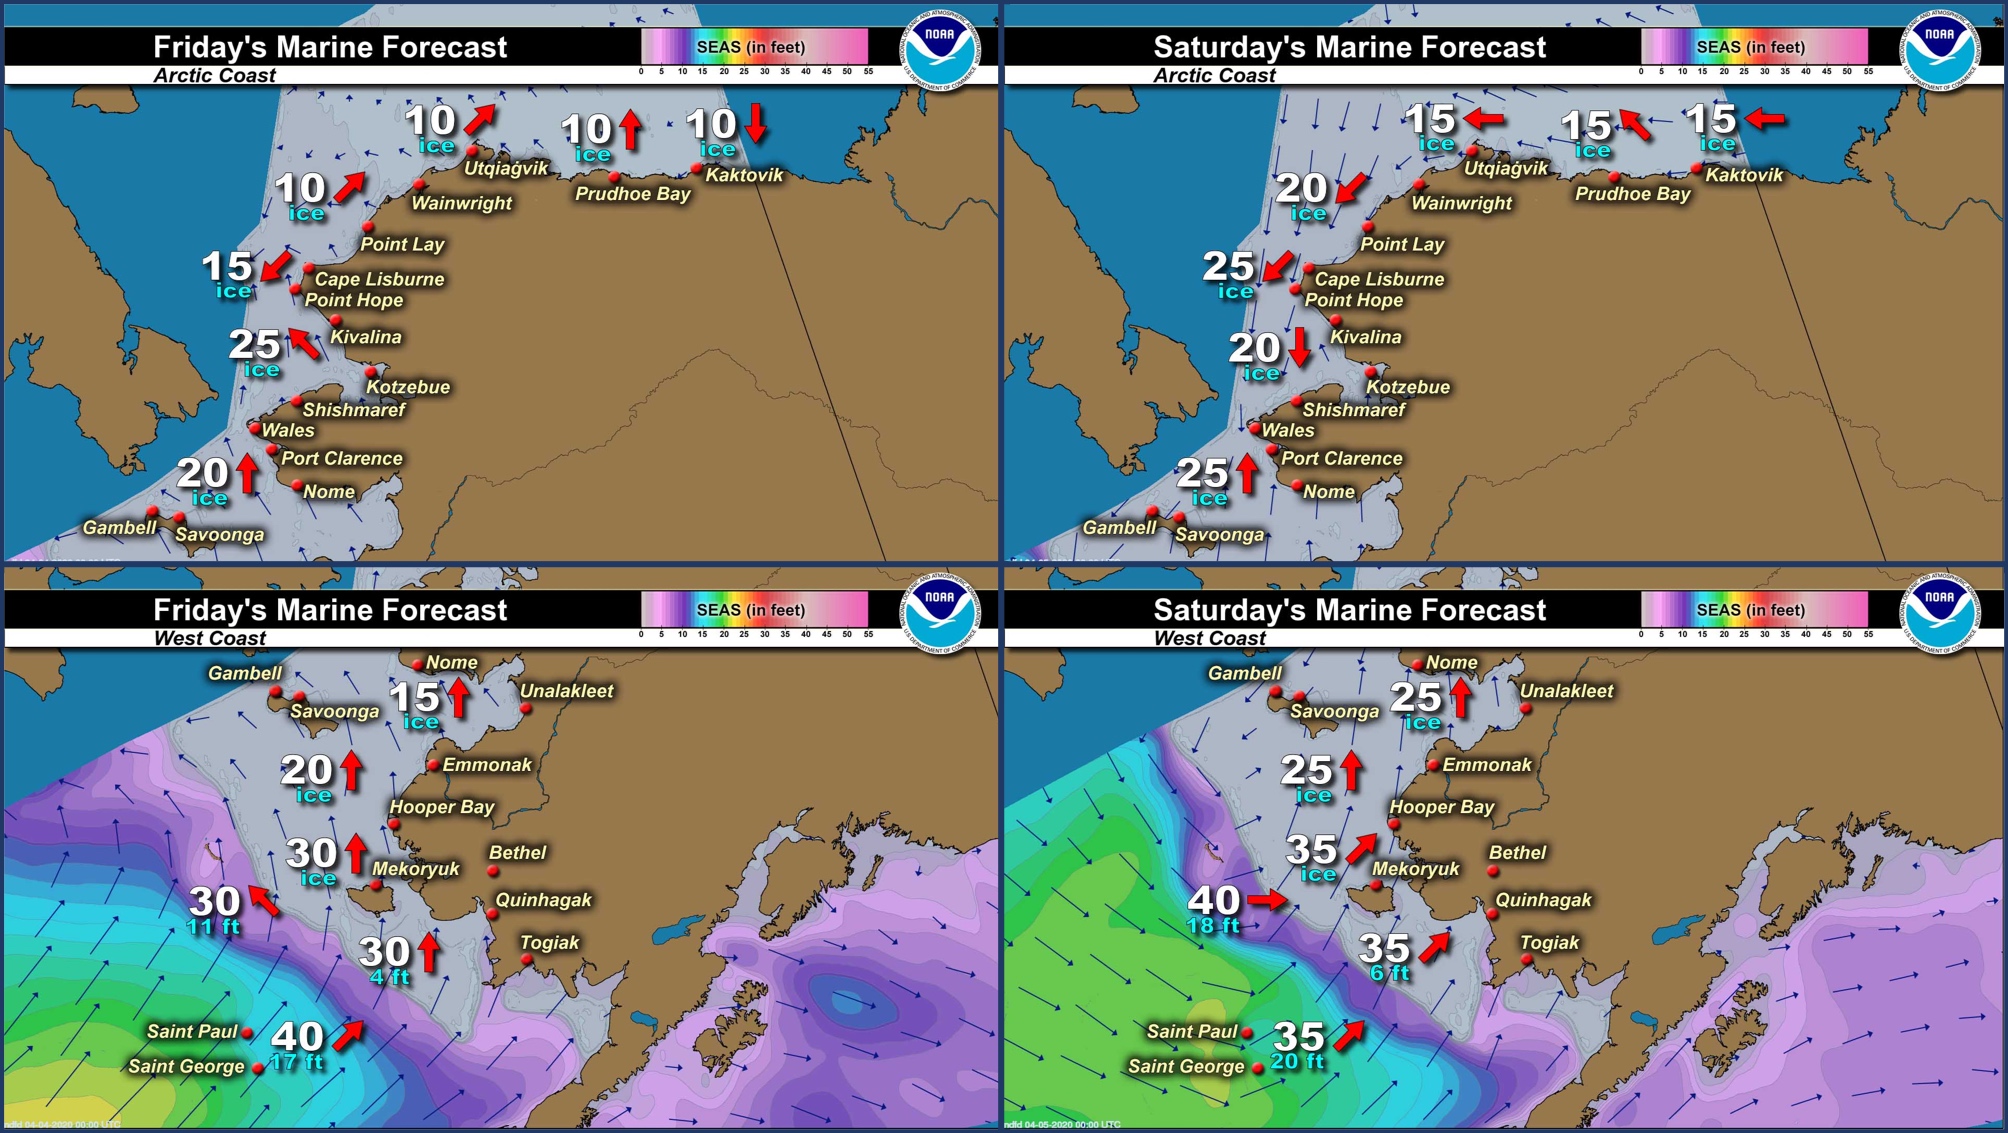
Marine forecast for the West Coast and Arctic Coast
Remote Sensing Images


Observations and Comments
Observations of Sea Ice Development
Observations from Gambell
3 April 2020 – Clarence Irrigoo, Jr.
I never went to north beach but the boats that went out got walrus. Today it’s wet and snowing

Observations from Port Clarence and Brevig Mission
3 April 2020 – Marcus Barr
Weather conditions are whiteout and snowing in Brevig Mission. Will try to get an observation over the weekend.
Observations from Savoonga
3 April 2020 – Aqef Waghiyi
No one boating since two or three days ago. There is a lot of open water. Windy from the south past couple of days. Not much going on due to the virus.


Observations from Wales
3 April 2020 – Robert Tokeinna, Jr.
I was seeing if weather would brighten up for a picture, but whiteout conditions has hampered my efforts so no photo. Once it clears I can take one. This week has been a windy and snowy week for Wales. Predominantly southerly winds temperatures between 10 to 30 above freezing. Unsure if there was any traffic other than local snowmachine trails to the north and south on the ice are noticed and continue to appear to be used. Weather has been very breezy. Local reindeer herder distributed meat to elders and larger families. No sign of snowbirds in which tells us spring is in full swing. With the pandemic and uncertainty times, I am unsure how it will affect hunters from gathering.
This ends my observation.