
Assessment of Current Ice Conditions Relevant to Distribution and Access of Walrus
State of the Ice at Season’s Start
Contributed by Matthew Druckenmiller (National Snow and Ice Data Center and SEARCH Sea Ice Action Team) & Hajo Eicken (University of Alaska Fairbanks)
As we entered 2019, few thought that the Bering Sea would see another winter like last year. But, this assessment did not hold for long. Between mid-January through early-March, the Bering Sea experienced an astonishing decline in sea ice coverage (see Figure 1), and by late February had dropped below the record low ice levels of 2018. Typically, this is a time of year when the Bering Sea ice cover is still advancing and building towards maximum coverage in the middle to end of March. The winter of 2019, however, was marked by the same large fluctuations in ice coverage and storm activity that defined 2018.
 compared to the long-term (1979-2016) average and range. Data is updated through March 20, 2019. (Source: Nimbus-7 SMMR and DMSP SSM/I-SSMIS Passive Microwave Data & Near-Real-Time DMSP SSM/I-SSMIS Daily Polar Gridded Sea Ice Concentrations; Data at 25 x 25 km resolution; Accessed from the National Snow and Ice Data Center.)")
Given recent and overall warming in the western Arctic, sea ice this year is thinner than the ice of past decades, which means that today’s thin sea ice is more susceptible to regional-scale shifts in its distribution by winds. Large ice floes and shorefast ice are also more likely to break up in response to wave action. During February, there was pronounced low pressure over the central and western Bering Sea and high pressure over the North American continent (see Figure 2), which brought warm southern air into the region, slowing ice growth and pushing sea ice far to the north. The month of February saw the most ice pushed northward to reveal vast stretches of open water. Between the last week in February through to the second week in March, the Bering Strait region was almost entirely ice free, as evident by the photos shown below.
")
.")
.")
At Wales, for example, the community lost their shorefast ice on or around March 4th. Robert Tokeinna posted his observation and a series of photos to the Local Environmental Observer (LEO) Network (https://www.leonetwork.org). In this March 5th posting, Robert observed that:
“Usually, Wales has shore fast ice until June or so in more recent years though it has been shorter; but for some reason and warming of the ocean, we lost all the shore fast ice. I rode up the beach to find all the ice not intact, but crushed and broken up. This is a very unusual event for Wales as many of our hunters rely on great ice conditions for whale and other sea mammal catch for food.”
See one of Robert’s photos below, alongside a historical photo from the Wales Sea Ice Dictionary, which shows June shorefast ice at Wales. Five to ten years ago, shorefast ice thickness at Wales in early March was measured at around three feet, growing to four feet or more by May, before spring shorefast ice break-up. Current conditions in the Bering Sea nearly guarantee that such past stable, thick shorefast ice conditions into late May or early June will not be observed this year or in the years to come.
Kotzebue Sound and much of the southeastern Chukchi Sea north to Kivalina were also almost entirely ice free during this mid-winter period (approx. 24 February to mid-March), which emphasizes that the changes observed during such extreme winters are not confined to the Bering Sea but are reaching further north. By the first week in March, sea ice extent in the Bering Sea was the lowest in the satellite record (1979–2019). However, ice coverage began to increase substantially through the middle of March, more so as a result of shifting winds rather than new ice growth, and is currently slightly above last winter’s record minimum. With much thinner ice, we can expect to see greater short-term variations in ice extent, as the ice responds readily to shifts in wind and air temperature.

).")
Sea surface temperatures throughout the winter have been very warm (up to 3ºC or 5ºF above normal), which has limited the ice’s ability to develop and thicken throughout winter. Figure 3 shows that on March 5th, which is the day of the lowest ice extent in March, there was a band of extremely warm water extending from the western Bering Sea into Bristol Bay, as well as “hotspots” in the northern Bering Sea and at the entrance to Norton Sound. In past years, growth and movement of ice into such areas of warm water would have consumed much of the heat. In the absence of ice, this season’s warm water will likely track northward throughout spring and contribute to an early seasonal ice retreat in the Bering Sea, as well as potentially in the Chukchi Sea.
 departure from normal (anomaly) on the March 5, 2019, which is the date of the lowest sea ice coverage in the Bering Sea in March (see Figure 1). The normal or average SST condition is defined over years 2003-2014. (Source: Daily, 1km SST anomalies based on the GHRSST Multiscale Ultrahigh Resolution SST dataset, accessed from the PO.DAAC at the NASA Jet Propulsion Laboratory.)")
WEEKLY OUTLOOK
Click the name of each community below to view more frequently updated and detailed information from the National Weather Service.
Forecast Synopsis for 21–25 March 2019
Synopsis. High pressure will move off to the north through Friday, then a series of lows will move northward through the Bering Sea through Monday.
Near St. Lawrence Island
The thickest sea ice is on the north and west sides of the island. Compact to consolidated ice pack extends from the north coast of St. Lawrence Island generally to the Bering Strait. Close ice pack with medium to big floes extends from both the east and west coasts of the island, into Russian waters to the west and up to 25 nm from the east coast. A polynya has continued to form on the south and southeast sides of the island, extending from 4 to 30 nm offshore. This polynya is filling in with new sea ice.
Nome
Shorefast ice extends up to one half nm from shore to the west of Nome. A polynya has formed from the Nome coast up to 5nm offshore, and is filling in with new sea ice. An area of close ice pack then extends 10 to 15 nm farther offshore, with ice cakes to big floes. To the south of that area is close ice pack consisting of ice cakes to medium floes less than one foot thick.
Wales to Shishmaref
The forecast has not yet begun for 2019 in this region. Please check back later for updates.
Little Diomede
The forecast has not yet begun for 2019 in this region. Please check back later for updates.
Forecast Discussion
Ice Forecast
For St. Lawrence Island: Sea ice will continue to compact against the north coast and fill in the polynya on the south side of the island through Saturday, then sea ice will begin to move northward again Sunday through Thursday. A polynya is expected to form on the north side of the island early next week, and sea ice will close off the polynya on the south side of the island and compact against the south coastline.
For Nome: The new sea ice that has recently formed within Norton Sound will continue to thicken through Saturday. As winds become southerly, sea ice will move back northward and compact against the north coastline of Norton Sound. By Friday, March 29th, much of the recently formed sea ice within Norton Sound will likely be melted once again.

Wind Synopsis
On St Lawrence Island, north winds 25 to 30 kt (29 mph to 35 mph) on Friday March 22nd will diminish to 15 kt (17 mph) Saturday morning March 23rd. Winds will shift to the southeast on Saturday afternoon and increase to 25 kt (29 mph) Saturday night and continue into Sunday March 24th. Southeast winds will diminish briefly Sunday night but then increase to 20 to 25 kt (23 to 30 mph) on Monday March 25th and persist into Tuesday March 26th. Winds will remain generally south to southeast 15 to 25 kt (17 to 29 mph) from Wednesday March 27 through Friday March 29th.
At Nome, east to southeast winds 15 to 20 kt (17 to 23 mph) on Friday March 22nd will persist through Saturday night March 23rd. Winds will increase to south to southeast 20 to 25 kt (23 to 29 mph) by Sunday morning March 24th. South to southeast winds will diminish briefly Sunday night but then increase to southeast 25 kt (29 mph) on Monday March 25th and persist into Tuesday March 26th. Winds will remain generally south to southeast around 15 kt (17 mph) through Friday March 29th.
Temperature Trend
High temperatures will be in the teens on Friday March 22nd over St Lawrence Island but warming into the 20's on Saturday March 23rd and persisting in the upper 20's to around 30 degrees through Friday March 29th. Low temperatures across St. Lawrence Island will be mainly in the lower 20's through Friday March 29th. High temperatures around Nome will mainly be in the 30's with lows in the 20's from Friday March 22nd through Friday March 29th.
Daily Weather, Wind, and Temperature Updates
The National Weather Service provides twice-daily, text only updates on the weather, wind, and temperature conditions in specific geographical zones. An interactive weather map for access to other Alaskan zones can be found here: http://weather.gov/anchorage/ice
Wind maps are updated daily and can be viewed here: http://www.weather.gov/afg/SIWO_overview
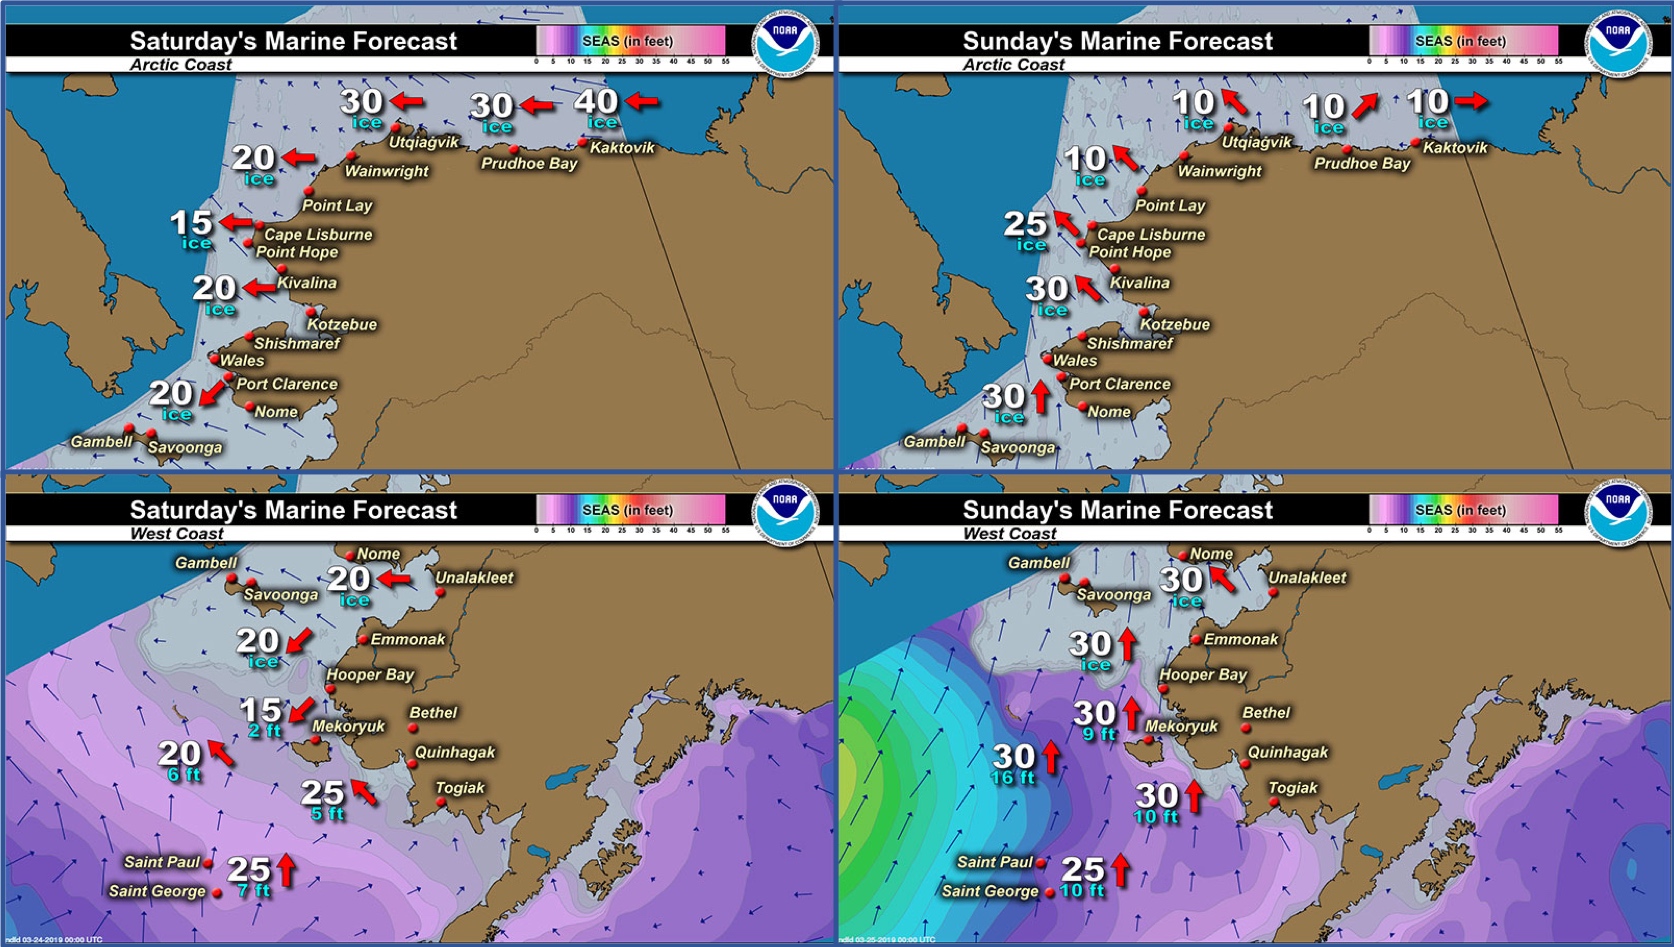
Marine forecast for the West Coast and Arctic Coast
Remote Sensing Images


Observations and Comments
Observations of Sea Ice Development
Observations from Nome
21 March 2019 – Boogles Johnson
The sea ice conditions in Nome are unstable and the shelf that broke off had returned last week but the current weather conditions have pushed the ice out. There’s shorefast ice being held together with some young ice but this is unstable and can leave the shore at any time. The weather has made it hard to go and hunt safely. I've heard of a few hunters that were able to get seals but have not heard of anyone getting walrus yet around Nome.


Observations from Gambell
21 March 2019 – Clarence Irrigoo, Jr.
We have lots of ice. Some parts of the beach have pressure ice.


Observations from Savoonga
21 March 2019 – Aqef Waghiyi
Windy from north, 40kts. No open water, no hunting this week.
Observations from Shishmaref
22 March 2019 – Annie Weyiouanna
I have attached pictures of our current sea ice. There was a few seals just chillin' on the ice but it is very white out here and a new snow fall. There is a little open water but we hope it freezes over so we can have a successful spring hunt. I hope this helps.


Observations from Port Clarence and Brevig Mission
23 March 2019 – Marcus Barr
Young/new ice formed. Some overflow along the beach and some of the main ice on the beach started to come up, cracks still visible.

