
Assessment of Current Ice Conditions Relevant to Distribution and Access of Walrus
State of the Ice at Season’s Start
Contributed by Matthew Druckenmiller (National Snow and Ice Data Center and SEARCH Sea Ice Action Team) & Hajo Eicken (University of Alaska Fairbanks)
Arctic-wide, this year’s winter maximum sea ice extent observed on March 7 was the lowest in the satellite record (the National Snow and Ice Data Center reported this on March 22, and will offer a more detailed report in April 2017). In fact, the last lowest three winter maximum extents have all occurred in the last three years (2015, 2016 and 2017). This year, sea ice coverage in the Bering Sea remained well below average, despite substantial advancement in coverage during February, due in part to a late fall freeze-up, south winds prevailing through early-winter (Figure 1), and unseasonably warm temperatures throughout winter (Figure 2).
 indicate a monthly average N-S wind blowing from the South, and negative values (purple, blue) indicate a monthly average N-S wind blowing from the North.")
 for the Bering and Chukchi Seas averaged over December 2016 to February 2017.")
At Shishmaref, Andrew Kakoona observed a late shoreline freeze-up on December 30, yet “due to strong southerly winds, the thin ocean sea ice blew away” (accessed from the https://www.leonetwork.org). This delay in freeze-up at Shishmaref certainly falls outside normal year-to-year variability. Furthermore, a late fall-freeze-up was observed along much of the eastern Chukchi Sea coast, from the Bering Strait northward to Utqiaġvik (formerly Barrow).
At Diomede, a similar observation from Opik Ahkinga indicated that conditions on January 11 resembled conditions typically observed in November.
“On January 11th, waves rolled in with the prevailing south winds. Our temperatures were above freezing, and the air wasn't so cold. The beach should have been covered with shore ice and frozen solid white rocks. Never in my life I'd ever seen unfrozen wrack on our beach way. I don't believe any local has.”…“A week later the ice came with the cold north winds. Our temperatures felt like -25°F degrees with a windchill, and many people were happy about that...even if it still wasn't cold enough.” (Accessed from the http://www.leonetwork.org)
The Bering and Chukchi seas region experienced mostly south winds from early December into mid-March (Figure 1), which assisted in delaying the movement of sea ice southward through Bering Strait. This, coupled with unusually warm temperatures, kept sea ice concentrations in the Bering Sea low throughout early winter. Surface air temperatures from December through February were upwards of 16°F above normal (Figure 2). Ice advanced into the region once North winds returned in the second week of January. By late March, the ice edge was well south of St. Matthew and Nunivak Islands with little observed open water stretches within the ice. However, with ice thickness in the region likely well below normal, the ice cover is more susceptible to shifting winds opening up large areas of open water.
On a more local scale, there is a notable shorefast ice feature that forms in most years along a shoal that extends northward of Wales and Lopp Lagoon (see Figure 3). This feature provides access to hunters from both Wales and Shishmaref, and also plays a role in shielding and constraining shorefast ice along the coastline between these two villages. Part of this stabilizing pressure ridge is mentioned in Robert Tokeinna Jr.’s SIWO contribution from Wales (and can be seen in the photo he provided here). This year, the ice feature established in January and has remained in place since then, providing fairly typical ice conditions along this coastline. The ice presently extending 20 to 35 miles offshore of Shishmaref (Figure 3) has only been in place since mid-March and, therefore, may not be well secured to shore. Similarly, on the southern side of the Seward Peninsula, ice is presently extending well offshore of Port Clarence, yet, the majority of this ice appears poorly attached with large cracks evident in satellite imagery. This ice is likely to detach near Port Clarence with warming temperatures, or with wind or current. Such lack of shorefast ice stability was also reported earlier in the winter for the eastern part of Norton Sound near Golovin (LEO observer Carol Oliver, https://www.leonetwork.org).
Open water persisted around St Lawrence Island through late January, with little to no shorefast ice forming until around the second week in February. The shorefast ice present in the bay between Gambell and Savoonga (see Figure 3) formed in mid-February and has persisted to present (late March).

Community Outlooks
NEW FOR 2017: Click the name of each community below to view more frequently updated and detailed information from the National Weather Service.
Near St. Lawrence Island
Sea ice is shorefast along the north, east, and southeast coasts of St. Lawrence Island out 2 to 7 nautical miles from the coast. A polynya has formed on the south side of the island up to 28 nautical miles offshore. Otherwise, close to very close pack ice surrounds the island.
Nome
Shorefast ice extends up to 4 nm from the Nome area coast. There is a polynya to the west that extends up to 6 nautical miles from the shorefast ice. Otherwise there is close to very close pack ice throughout the northern portion of Norton Sound.
Wales to Shishmaref
Shorefast ice extends to approximately 10 to 12 nautical miles from the coast between Wales and Shishmaref. Beyond the shorefast ice is very close pack ice.
Little Diomede
Close to very close pack ice surrounds Little Diomede Island.
Forecast Discussion
Ice Forecast
Sea ice will continue to be very closely packed through April 4th near Wales to Shishmaref coast, Diomede, and the north side of St. Lawrence Island, while the polynya on the south side of St. Lawrence Island will likely continue to expand through Wednesday, April 4th. The polynya to the west of Nome will likely expand southward, and possibly eastward toward Nome as well.
Weather System/Wind Synopsis
Winds on Friday, March 31st will be moderate north to northeast winds through the Bering Strait and northern Bering Sea (15 to 25 kt or 20 to 25 mph) which will persist through the weekend before decreasing to 10 to 15 kt (15 to 20 mph) on Sunday April 2nd. The surface pressure gradient will weaken resulting in decreased winds becoming north to northwest through Wednesday, April 5th. The pressure gradient will then re-strengthen in the later part of next week from Thursday, April 6th through the weekend of April 10th with north winds of 15 to 20 kt (20 to 25 mph).
Temperature Trend
During the forecast period, temperatures are anticipated to be below normal (10 to 15 degrees below normal for areas north of the Bering Strait and 5 to 10 degrees below normal for the northern Bering Sea) through Monday, April 3rd. There will be gradual warming from Tuesday, April 4th through the Saturday, April 8th with only 5 to 10 degrees below normal for areas north of the Bering Strait and warming temperatures to the lower 20s for areas in the northern Bering Sea.
Daily Weather, Wind, and Temperature Updates
The National Weather Service provides twice-daily, text only updates on the weather, wind, and temperature conditions in specific geographical zones. An interactive weather map for access to other Alaskan zones can be found here: http://weather.gov/anchorage/ice
Wind maps are updated daily and can be viewed here: http://www.weather.gov/afg/SIWO_overview
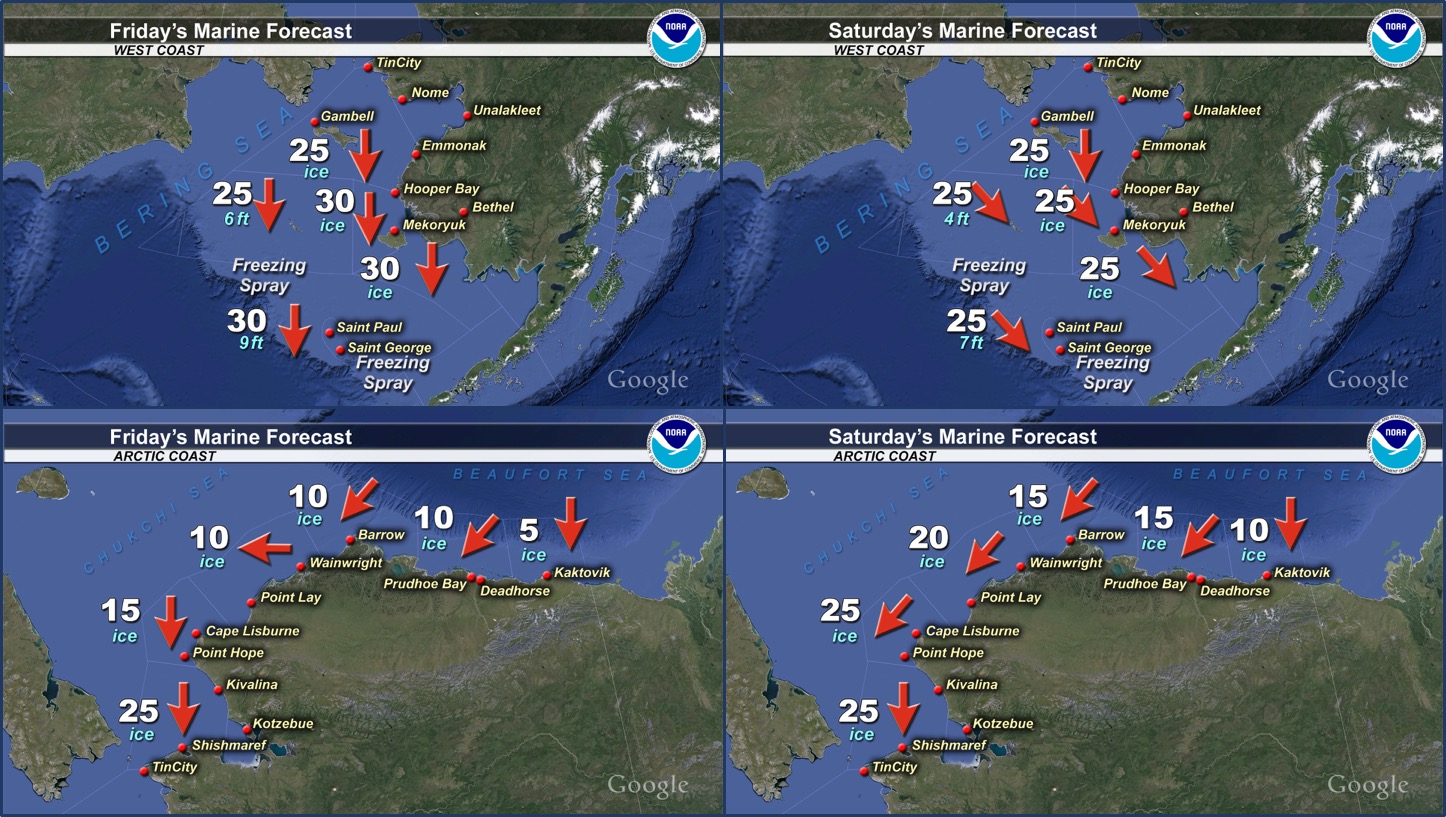
Marine forecast for the West Coast and Arctic Coast
Remote Sensing Images


Observations and Comments
Observations of Sea Ice Development
Observations from Nome
29 March 2017 – Boogles Johnson
The ice is as deep as a standard gas powered ice auger almost 4' thick. I believe the ice this year will be excellent for the spring hunting. We have had a "normal" winter this year and there hasn't been extensive movement of the ice through the winter like the past couple of winters.


Observations from Wales
29 March 2017 – Robert Tokeinna, Jr.
This week the flow ice continued to move back and forth with pressure ridges on the rise as we had wind shifting back and forth with Northerly and Southerly winds. I have started to see and hear the presence of Snow birds and heard reports of Sea Gull spotted near the edge of the ice. The spotting of these two birds means one of two things. One, sign of spring and open water. Two, warming of air and open water nearby is possible. Polar Bear Watch crew placed hair collecting pods for research purposes. Still too much ice to hunt nearby. Cold winds and high pressure have been prominent in our weather past couple weeks, draws more freezing temperatures and mix of snow.
Observations from Shishmaref
29 March 2017 – Curtis Nayokpuk
Cold Northerly winds have kept shore fast ice stable for the last month. After late freeze up strong North winds piled up sea ice up to a foot thick and grounded local ice preventing off shore South to South East winds from blowing ice out as in previous years. Latest GINA pictures show leads 30 miles to NW but until break up for our area a couple months away for Bearded Seals and Walrus local hunters are out after Caribou before they move North for the summer.
Links to check out:
NOAA WAVE WATCH III- Alaska region i.e. "wind speed and direction" great to see wind forecast - http://polar.ncep.noaa.gov/waves/viewer
GINA PUFFIN FEEDER - http://feeder.ginaalaska.edu
POLAR VIEW- (next S1 foresight scheduled for SIWO areas 3-31-17) http://www.polarview.aq/arctic
FAA WEATHER CAMERAS - http://avcams.faa.gov/sitelist.php
WALRUS SCIENCE - www.walrusscience.com


Observations from Gambell
1 April 2017 – Clarence Irrigoo, Jr.
See herd of walrus on ice. About 20. Seven miles from shore.