By: Amy Sakura Hendricks, University of Alaska Fairbanks
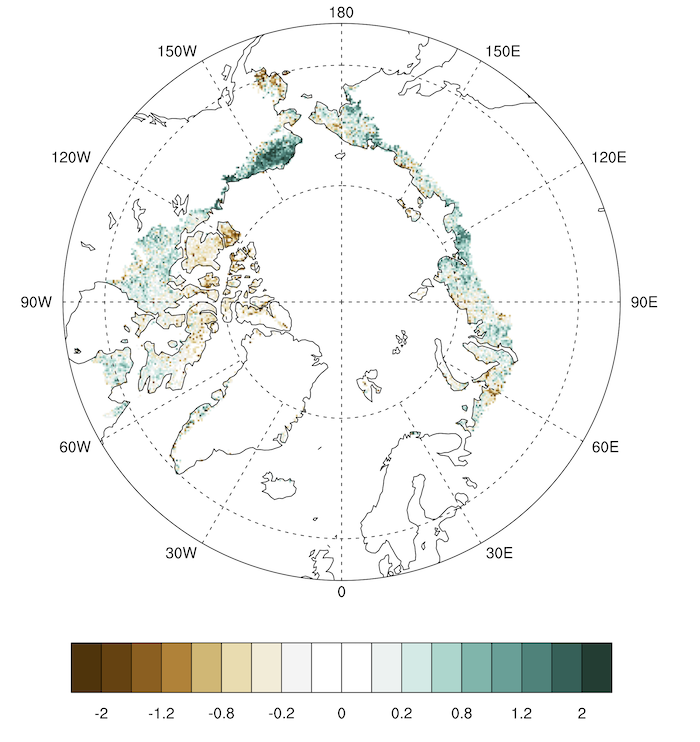
Increasing productivity of tundra vegetation is a defining feature of Arctic climate change. Greater photosynthetic activity is a result of rising temperatures, which allows the plants to grow taller and bushier and spread more readily across tundra regions. These changing spatial patterns are widespread across the circumpolar Arctic and can be studied from satellite imagery. Satellite sensors like the Advanced Very High Resolution Radiometer (AVHRR) aboard NOAA satellites capture infrared and near-infrared wavelengths that are unique to photosynthetic processes. Researchers use that information to calculate a widely used proxy for vegetation productivity, known as the Normalized Difference Vegetation Index, or NDVI. Higher values of NDVI indicate greater plant productivity. While the Arctic overall exhibits increasing NDVI trends (Figure 1), southwest Alaska's Yukon-Kuskokwim Delta (YKD) has appeared repeatedly as a notable region of declining NDVI, which has puzzled climate scientists for some time.

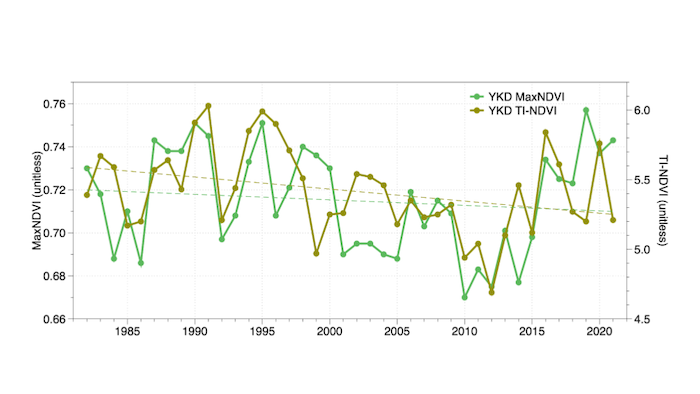
A new 40-year analysis of NDVI trends in the YKD reveals an unmistakable long-term pattern of rising and falling vegetation productivity for 1982–2021 (Figure 2). The two green lines in the graph represent two kinds of NDVI that are helpful for understanding variations in vegetation productivity: maximum NDVI (MaxNDVI; lime green) represents the peak photosynthetic activity or "greenness" in a growing season; time-integrated NDVI (TI-NDVI; olive green), represents the cumulative sum of bi-weekly NDVI values, which is particularly useful in climate research as it incorporates the entire length of the growing season. Both MaxNDVI and TI-NDVI show similar decadal variability on the YKD, increasing early in the record until the mid-1990s, followed by a steady decline until around 2010 when the trend becomes positive again. The early positive trends were halted abruptly for the 1992 growing season following the 1991 eruption of Mt. Pinatubo in the Philippines. Corresponding dashed straight lines in the graph represent 40-years of trends of NDVI. Despite decadal variability being obvious in the NDVI time series, linear trends—based on linear calculation used to characterize a non-linear time series—are weakly negative over the full data record.

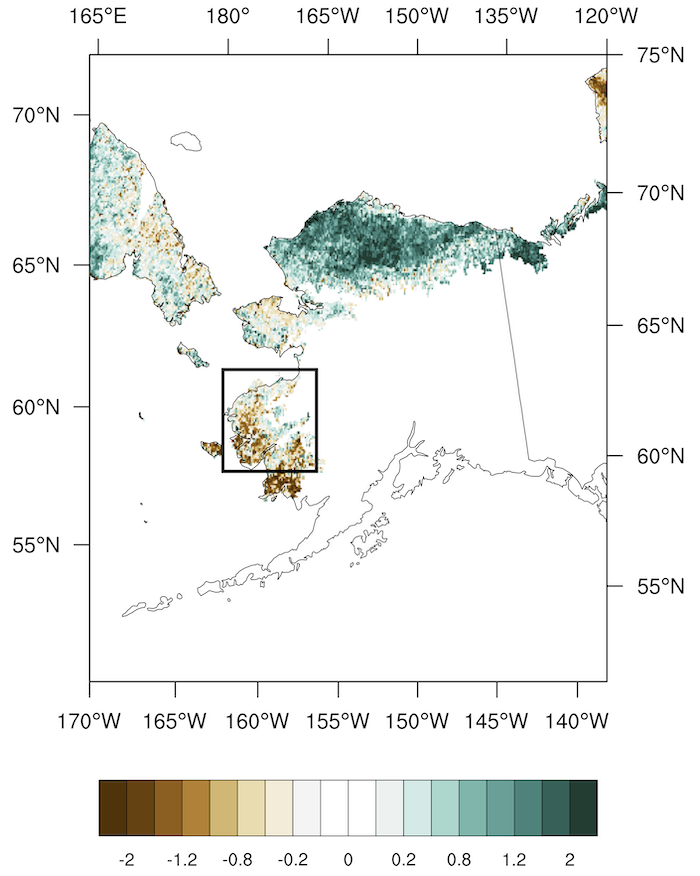
So, what's behind the long-term variability of NDVI on the YKD? Much like the rest of the Arctic tundra, spring sea ice concentration (SIC) within 100 kilometers of the coastline is a strong driver of vegetation productivity. As sea ice melts and retreats earlier in the spring, more warmth is available to heat the atmosphere and land for plant growth during the summer months. Spring SIC in the eastern Bering Sea along the YKD coastline exhibits a markedly similar, but opposite, low-frequency pattern compared to NDVI on the YKD for 1982–2021, with a strong declining trend since 2010. The link between spring SIC and NDVI on the YKD is confirmed in the growing season temperature record, which also exhibits a compellingly similar low-frequency pattern over the same time-period, with a steep rise in temperature in the most recent decade. Indeed, the YKD shows up as a distinct area of deep-green positive trends when we look at NDVI trends since 2010 (Figure 3). After 2010, the sea ice, temperature, and NDVI exhibit strikingly similar variability.


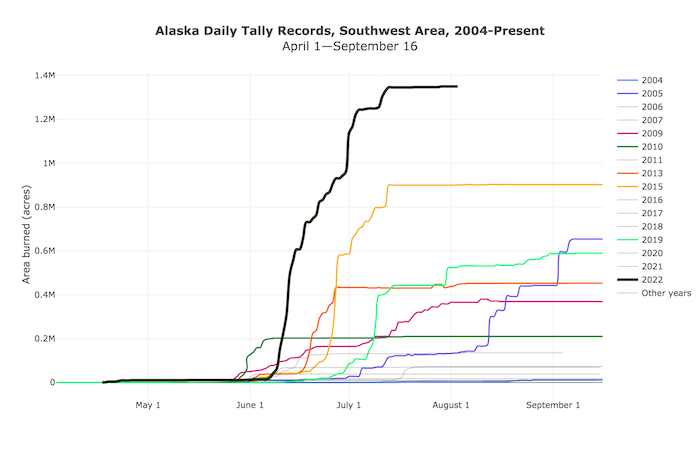
Our key finding that spring SIC is a low-frequency driver of NDVI trends on the YKD is just the beginning. As Arctic sea ice continues its ominous decline, what other key climate drivers of vegetation productivity might emerge? Warmer climates call for increased fire potential, a concern that was dramatically illustrated by the extraordinary 2022 fire season in Alaska's southwest fire management area, which contains the YKD study region. The southwest area burned a record 1.3 million acres, surpassing the record set in 2015 by over 400,000 acres (900,000 acres burned in 2015; Figure 4). Forthcoming research focuses on the hydrologic cycle as we continue analyzing long-term climate trends and variability to better understand how tundra vegetation on the YKD might be impacted. Our study highlights the value of long-term satellite data records for understanding Arctic climate systems. As sensors become replaced over time, we must be able to robustly stitch together a continuous data record to better understand and monitor key indicators in the supremely complex Arctic climate system.
For questions, please contact Amy Hendricks
About the Author
 Amy Sakura Hendricks is a Graduate Research Assistant at the University of Alaska Fairbanks (UAF) working toward a PhD in Atmospheric Sciences. After completing her undergraduate education in Meteorology at the University of Oklahoma, Alaska called and she headed north from the mid-latitudes to begin researching Arctic climate at UAF. Since 2012, Amy has contributed to research exploring the driving forces of climate variability and change on vegetation productivity, and climate impacts on subsistence food security and information needs in Alaska. Her hobbies include volunteering with the Literacy Council of Alaska as an English as a Second Language teacher, and hunting, fishing, and exploring the wild rivers and mountains of Alaska with partner Jeremy, and dogs Solstice, Mare, and Bou.
