By Beth Grassi, EarthScope National Office
From seismic rumblings to meteorological measurements, the EarthScope Transportable Array (TA) of seismic stations collects earthquake data and much more. EarthScope's primary goal is to explore the geological structure and formation of the North American continent. Other instruments sometimes accompany the high-quality seismometers, such as strong-motion (large earthquake) sensors, infrasound microphones, meteorological sensors, and soil-temperature gauges. The TA grid of 280 stations across Alaska and western Canada, spaced about 85 km apart, covers areas that previously had sparse or no monitoring, especially southwestern Alaska, the Yukon basin, and Alaska's North Slope.
EarthScope partner Incorporated Research Institutions for Seismology (IRIS) handles TA installations and data management—integrating the data flow and format in ways that are usable and familiar within different fields. (&feature=youtu.be">Time-lapse video of an installation) All EarthScope data are available online for free. Instruments record continuously and most data is uploaded in near real-time.
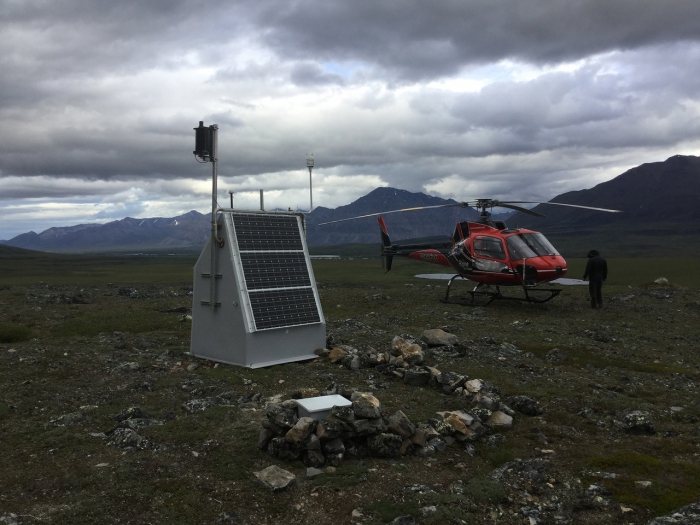
Deployment of the TA leapfrogged across the U.S. in two-year increments, starting on the West Coast in 2004. The array is currently scheduled for removal by 2020. Ongoing discussions with several agencies and organizations relate to extending the deployment.
Seismic Sea Ice
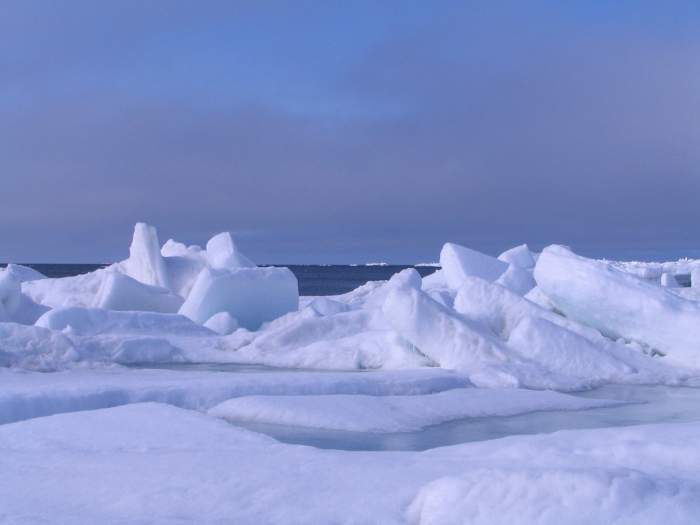
Recent National Oceanic and Atmospheric Administration (NOAA) research using Arctic coastal TA stations explores how microseism data could improve sea-ice monitoring. Ocean waves beating against the shore or ocean bottom generate microseismic signals that are modulated by the sea ice.
The continuous data from TA stations could allow for detailed monitoring of sea-ice coverage and thickness, potentially pinpointing events such as freeze-up in fall and short-term, open-water events more accurately than satellite images taken weeks apart. The TA stations also avoid data gaps from clouds blocking satellite imagery. This information is critical to evaluating safe sea-ice access and expanding understanding of climate change effects. "The end goal is to improve sea-ice forecasts in increments of hours, weeks, months, and longer for modeling," says Sinéad Farrell, a visiting scientist at NOAA from University of Maryland.
Forecasting for Wildfire Management
During Alaska's wildfire season, Heidi Strader, the Predictive Services Fire Weather Program Manager of the Alaska Interagency Coordination Center, presents daily fire-danger forecasts to half a dozen state and federal agencies, fire managers, and smokejumpers. The Alaska Fire and Fuels forecast maps are available online, including data for past seasons. Fire-danger forecasts combine temperature, relative humidity, 24-hour precipitation, and wind speed to calculate various fuels indices. Fire managers may pre-position fire crews based on the fire-danger forecast.
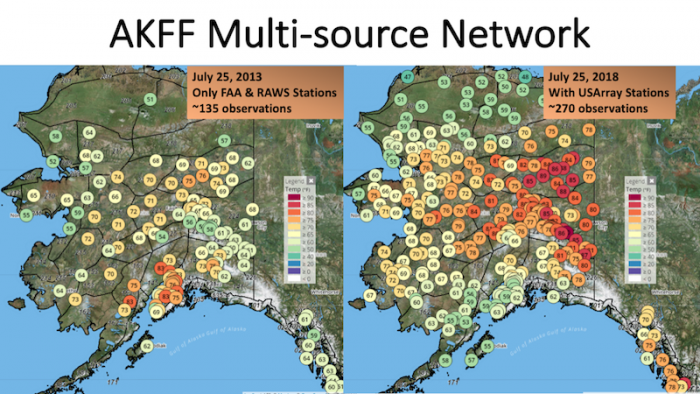
The TA stations nearly doubled the weather data available to fire managers. Without coverage, fire forecasters have to assume one weather station is representative of an entire area. "But you can have a high danger next to moderate, so the landscape is more complex," says Strader. Asked if the TA deployment could be extended, Strader commented: "We'd like to be able to build a historical database. We say a minimum of 5 years, and by 20 years you can start seeing trends."
Permafrost Monitoring
NASA's Arctic-Boreal Vulnerability Experiment (ABoVE) contributed soil-temperature gauges to the TA stations to monitor permafrost distribution. The gauges don't broadcast data, so in June 2018 IRIS technicians collected the first data in person and researchers will soon process it.
The TA stations have expanded both the geographic range and landscape-type coverage of the ABoVE permafrost study. "Historically, we were collecting data along roads and close to villages and populated centers," says Dmitry Nicolsky, University of Alaska Fairbanks (UAF) faculty and ABoVE researcher who studies permafrost. The TA stations extend coverage to remote sites in the Yukon basin and southwest Alaska. While previous studies focused on shrub, tundra, or forest habitat, TA stations are drilled into accessible bedrock, providing a more complete picture across diverse habitats. This stage of the ABoVE research will provide a baseline for the present climate and help with modeling verification.
Weather Forecasting
Weather forecasts are crucial for many Alaskans. According to Carven Scott, the National Weather Service's (NWS) Alaska Region Director, Alaska's three forecast offices cover an area that would have fifty offices in the Lower 48.
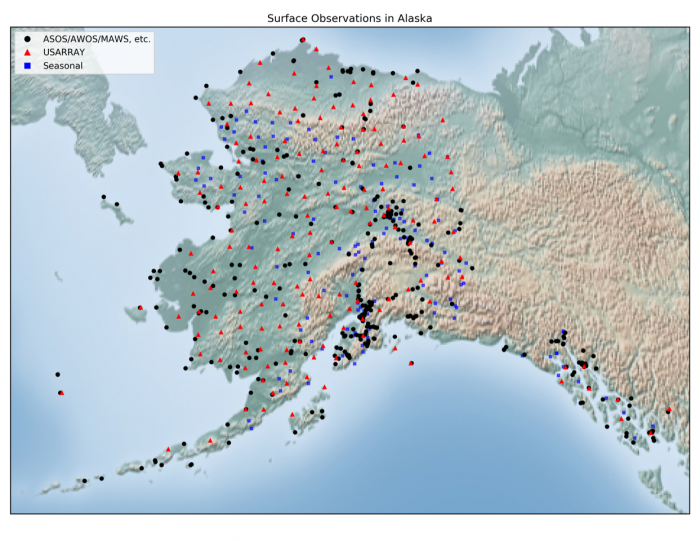
The TA stations have helped fill data gaps in northern Alaska, "where we have never had surface observations since the weather service has been in Alaska," says Scott. "It's given us insight into what's going on up there, and it's been invaluable." The TA data is fully integrated into the NWS forecasting system in near real-time, available on the MesoWest website. The TA data have improved analysis and documentation of extreme events, such as the September 2017 heavy rains in northwestern Alaska. Some of the TA sites in the Brooks Range and North Slope directly improve the forecast by verifying the freezing level, helping meteorologists determine if precipitation will fall as snow or rain.
Changing the View of Alaska's Earthquakes
The primary instruments of the TA stations—seismometers—provide high-resolution seismic data. The array has increased the number of earthquakes detected in northern Alaska, especially smaller-magnitude events (see Figure 5). The TA is regularly detecting magnitude 4 earthquakes north of the Brooks Range. Recently, the TA captured the North Slope's strongest recorded earthquake, a magnitude 6.4.
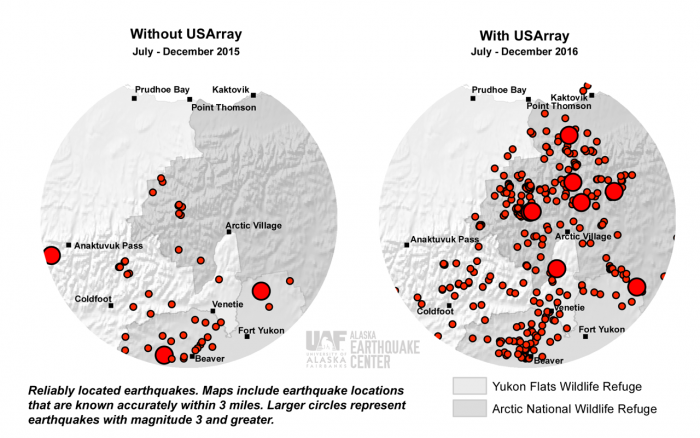
Carl Tape, a professor at University of Alaska Fairbanks (UAF) and Co–Principal Investigator (Co–PI) for the EarthScope National Office (ESNO), used TA data to supplement a smaller seismic network placed in central Alaska. The TA instruments detected very low-frequency seismic waves, the first time this type of earthquake was detected outside of a subduction zone. "We're taught most earthquake activity is at plate boundaries, but we're detecting earthquakes and exotic events 700 km from the boundary," says Tape.
Monitoring Volcanoes Using Infrasound
Infrasound is nature's sub-subwoofer, consisting of sound waves below the limit of human hearing (below 20 Hertz). David Fee, a professor at UAF and Co-PI for ESNO, uses infrasound to monitor volcanic eruptions. The TA infrasound instruments captured the unexpected 2016 eruption of the Pavlof volcano. Fee's team found some stations detected infrasound better than others based on proximity to the source and how background noise interferes with the signal. "In Interior Alaska, where it's not very windy, we may have a better chance of picking up an infrasound signal than on the windy coast. Site selection is really important," says Fee. The goal is creating an algorithm that can process infrasound data and backtrack to locate the source. Once the algorithm is accurate, the next step is to test it as a near real-time eruption detector.
"The TA stations are like a Swiss army knife—they aren't just weather stations or seismic stations, you could add more sensors," says Scott. "For example, methane or black carbon sensors to measure changes in the Arctic. A lot of what you can do with the TA is limited only by scientists' imagination."
Learn More
Further information about the TA deployment to Alaska and Western Canada is available on the USArray webpage.
Access TA station data on the IRIS website.
More about the possibility of extending the TA operation beyond 2020 is available on the UAF Alaska Earthquake Center webpage.
For questions, please contact Bob Busby, TA Manager at IRIS, busby [at] iris.edu or Mike West, State Seismologist, at the Alaska Earthquake Center, mewest [at] alaska.edu.
Author Bio
 Beth Grassi is the science writer for the EarthScope National Office, which is housed at the University of Alaska Fairbanks. She has worked as a science writer for various organizations in Alaska for nearly 15 years, covering topics from ecology to earth science. At EarthScope, she works with scientists that are funded by EarthScope or that use EarthScope data, creating appealing, non-technical accounts of their research. She also produces the quarterly inSights newsletter, writes Humans of EarthScope articles to encourage a new generation of earth scientists to join the field, and works with the media. To learn more about EarthScope science and education projects, email Beth at bagrassi [at] alaska.edu or visit www.earthscope.org.
