By: Harry Stern, Polar Science Center, Applied Physics Laboratory, University of Washington
Historical documents can provide valuable context for current changes in sea ice and climate. Funded in part by a grant from the National Aeronautics and Space Administration (NASA), the author examined journals and charts from Captain Cook’s third voyage. The article below is a condensed version of his findings previously published in the journal Polar Geography.
On 11 August 1778, Captain James Cook sailed north through Bering Strait in search of the Northwest Passage under secret instructions from the British Admiralty. A week later, his progress was halted by "ice which was as compact as a Wall"at 70°44′ N, about 30 kilometers north of Icy Cape.1 Turning southwest and then west, Cook sailed close to the ice edge for the next 11 days, trying to find an opening to the north. But on 29 August he reached the coast of Siberia at 69°N without finding a break in the ice. He sailed south through Bering Strait on 2 September.
Tragically, Cook was killed in Hawaii in February 1779. Command of the expedition passed to Charles Clerke, who returned to the Arctic in July 1779 to continue the search for the Northwest Passage. But Clerke also encountered impenetrable pack ice, tracing the ice edge at latitudes 69-70°N without finding an opening.
The journals of Cook and Clerke provide ample evidence that they traced the ice edge closely. Consider Cook's entry of 19 August 1778, in which he discusses walruses (also called Sea Horses) at some length, writing, "They lay in herds of many hundred upon the ice, huddling one over the other like swine, and roar or bray very loud, so that in the night or foggy weather they gave us notice of the ice long before we could see it".2 This may be the earliest recorded instance in history of remote sensing of sea ice!
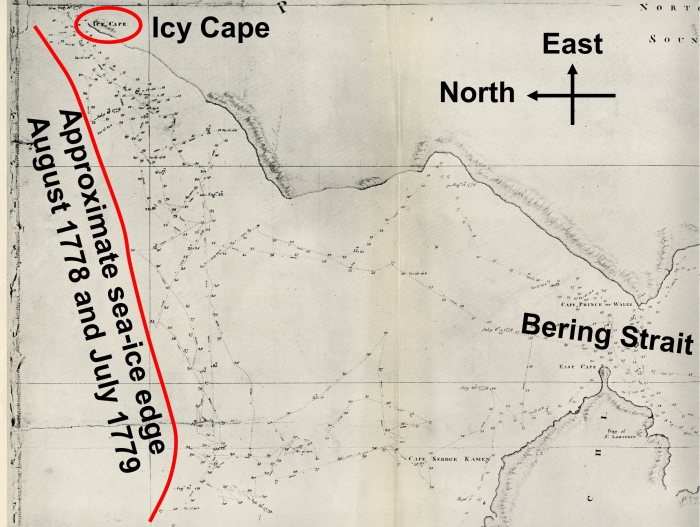
Cook and his officers made several charts of their positions north of Bering Strait. Figure 1 is a detail from one such chart by Henry Roberts, master's mate on Cook's ship Resolution. Note that East is at the top of the chart with North to the left. The approximate location of the sea-ice edge in August 1778 and July 1779 is indicated in red, based on the ship tracks.

The significance of this chart is that it provides the earliest historical record of the summer sea-ice edge in the Chukchi Sea. Stern (2015) reviewed the history of sea-ice observations in this "western portal of the Northwest Passage" from the time of Cook to the present, concluding that: 1) While there was some variability in the position of the summer sea-ice edge from year to year and decade to decade, there was no long-term trend from the time of Cook up to the 1990s; and 2) Starting in the mid-1990s, the summer sea-ice edge began retreating farther north, and in the last decade has consistently retreated well northward of its historical position.
This change starting in the 1990s has been confirmed by other analyses such as Barnhart et al. [2015]. In fact, the region where Cook ventured in 1778 has experienced one of the most severe reductions in the length of the sea-ice season of any place in the Arctic over the last 20 years [Parkinson, 2014]. If sea-ice conditions in 1778 had been as they are today, Cook would not have encountered ice at all; he would have continued along the coast of Alaska, rounded Point Barrow, and seen the coastline trending eastward into the distance, giving him confidence that he had discovered a navigable western approach to the Northwest Passage.
Text in the above article is condensed from:
Stern, H.L. (2016). Polar maps: Captain Cook and the earliest historical charts of the ice edge in the Chukchi Sea, Polar Geography, 39:4, 220-227, DOI: 10.1080/1088937X.2016.1236845
http://dx.doi.org/10.1080/1088937X.2016.1236845
For further information, please contact Harry Stern (harry [at] apl.washington.edu).
References
Barnhart, K.R., C.R. Miller, I. Overeem, and J.E. Kay (2015). Mapping the future expansion of Arctic open water, Nature Climate Change, doi:10.1038/nclimate2848.
Beaglehole, J.C., editor (1967). The Journals of Captain James Cook on His Voyages of Discovery, vol. 3, part 1, The Voyage of the Resolution and Discovery, 1776–1780, Cambridge: Cambridge University Press for the Hakluyt Society.
Parkinson, C.L. (2014). Spatially mapped reductions in the length of the Arctic sea ice season, Geophys. Res. Lett., 41, 4316–4322, doi:10.1002/2014GL060434.
Skelton, R.A., editor (1955). Charts & Views Drawn by Cook and his Officers and Reproduced from the Original Manuscripts, Cambridge, published for the Hakluyt Society.
Stern, H. (2015). Sea Ice in the Western Portal of the Northwest Passage from 1778 to the 21st Century, in Arctic Ambitions: Captain Cook and the Northwest Passage, Barnett and Nicandri (editors), University of Washington Press, Seattle and London.
 Harry Stern is a mathematician at the Polar Science Center, Applied Physics Laboratory, University of Washington, Seattle, where he studies Arctic sea ice using satellite data. Current interests include the changing sea-ice habitat of polar bears and the history of Arctic exploration. He participated in the Around the Americas expedition in 2009, sailing through the eastern half of the Northwest Passage. He has been with the Polar Science Center since 1987.
