Outlook Report
Executive Summary
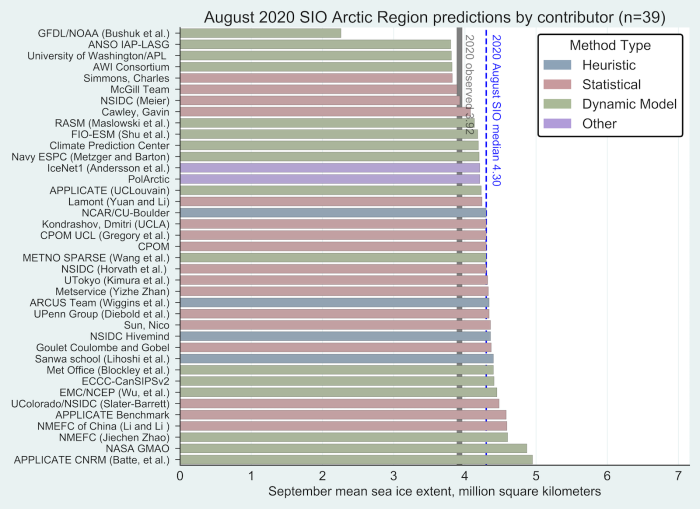
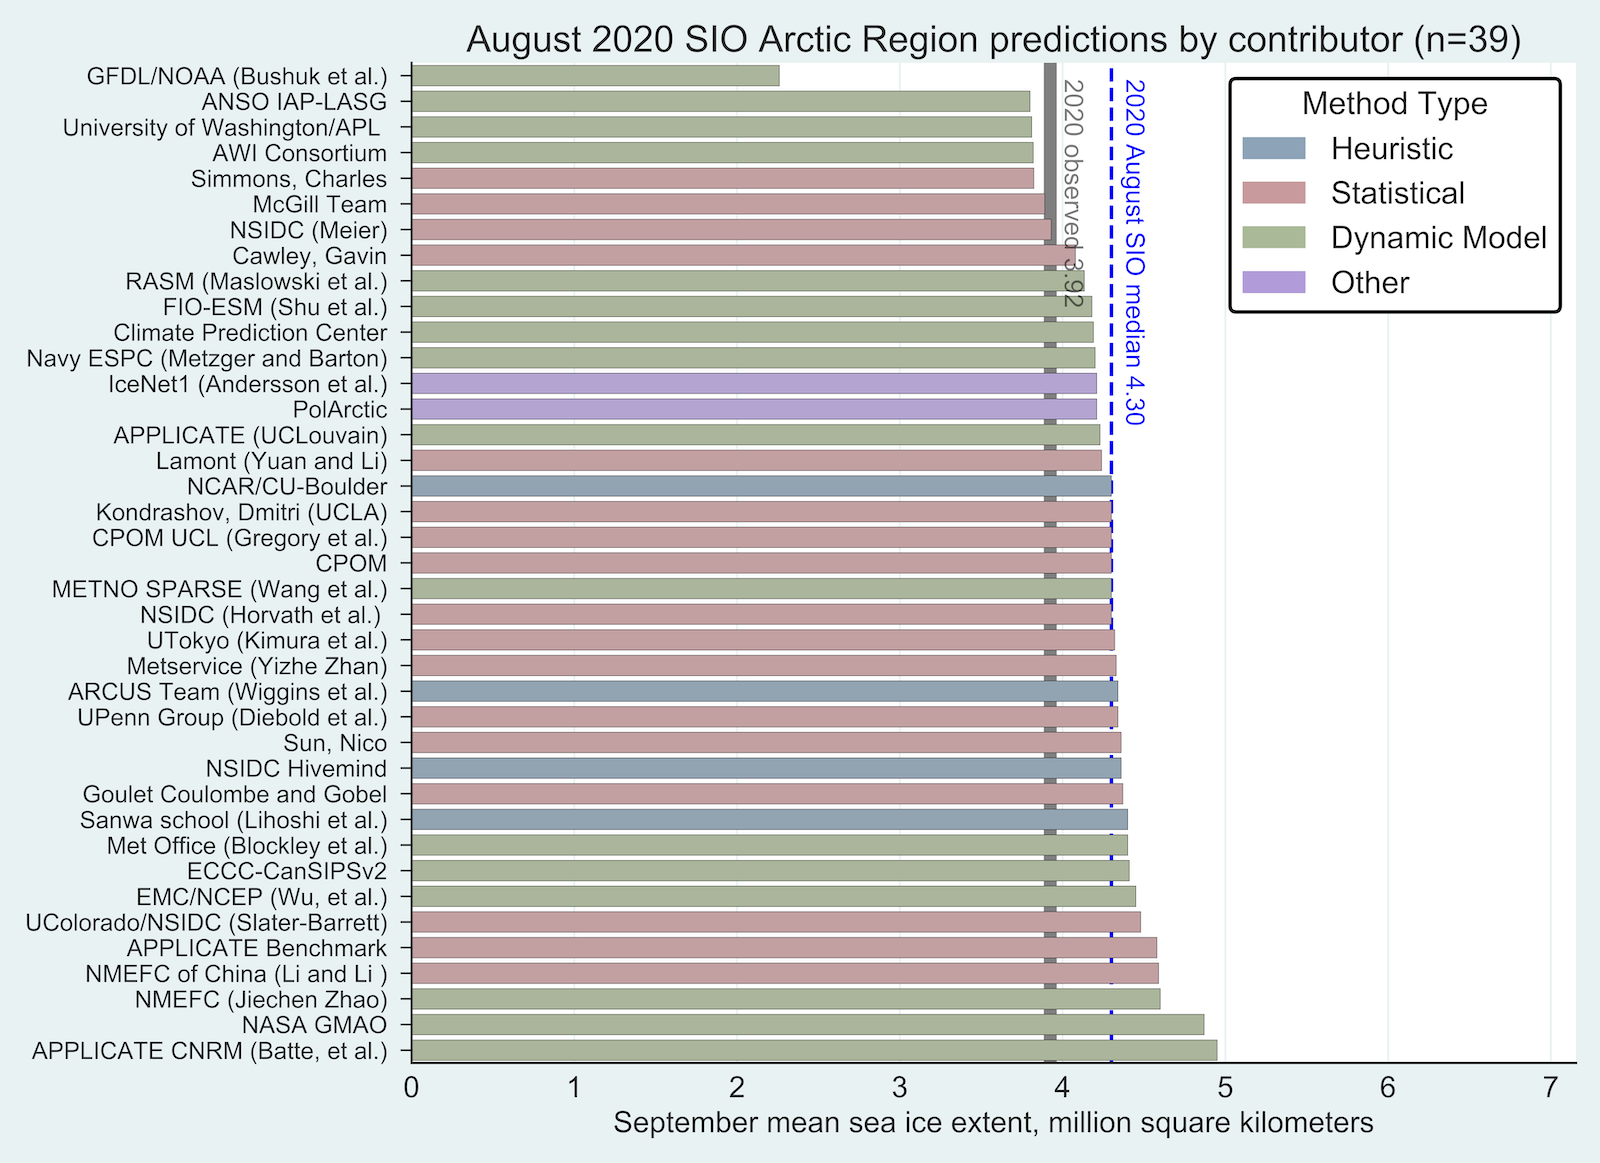
The Arctic has reached the end of the 2020 summer retreat season. The September monthly average sea ice extent was 3.92 million square kilometers, based on the National Snow and Ice Data Center (NSIDC) Sea Ice Index (SII). This is the second lowest extent in the satellite record (the multichannel passive microwave satellite record started in 1979). This is lower than the median September 2020 Outlook values from each of the three months of submissions. The June, July, and August median Outlooks were 4.33, 4.36, and 4.30 million square kilometers, respectively. It also was outside the interquartile range from the months, which ranged from 4.06 to 4.6 million square kilometers.
This interim report is intended as a quick post-season update that summarizes how the outlooks did in comparison to the observed September monthly mean extent. A full post-season report to be published in February 2021 will include an in-depth analysis of factors impacting sea ice this past summer, further discussion about the outlooks, comments on regional observations, predicted spatial fields, Antarctic contributions, and a summary from the Sea Ice Drift Forecast Experiment.
This Interim Post-Season Sea Ice Outlook Report was developed by lead author Walt Meier, NSIDC (Overview and discussion of current conditions); Uma Bhatt, Geophysical Institute, University of Alaska Fairbanks (UAF); John Walsh, International Arctic Research Center (IARC), UAF; and Rick Thoman, Alaska Center for Climate Assessment and Policy, IARC, UAF (Discussion of current conditions); Molly Hardman, NSIDC (statistics and graphs); Betsy Turner-Bogren, Helen Wiggins, and Stacey Stoudt, ARCUS (report coordination and editing); and the rest of the SIPN2 Leadership Team.
Overview
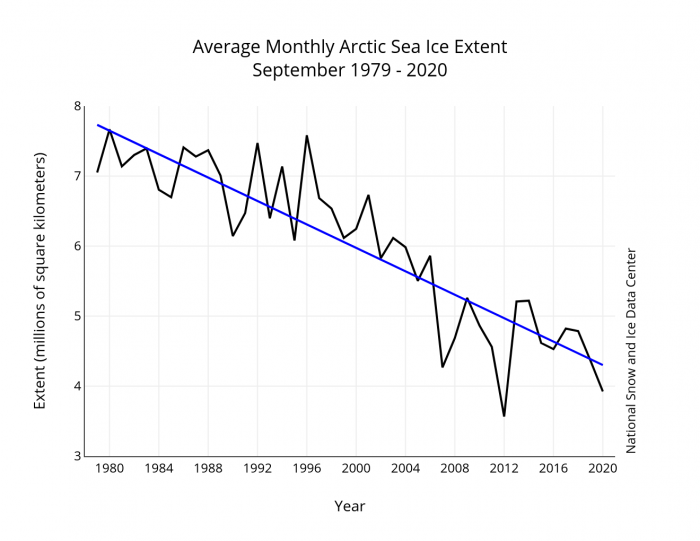
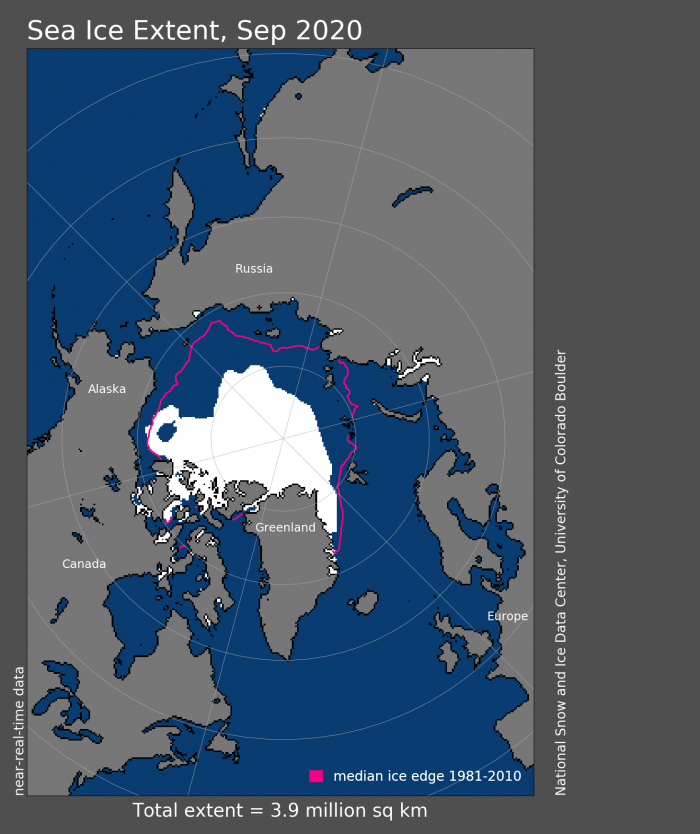
Based on the NSIDC Sea Ice Index (SII, Fetterer et al., 2017), the 2020 September average sea ice extent was 3.92 million square kilometers, second lowest in the multichannel passive microwave satellite record that began in 1979 (Figure 1); only September 2012 had a lower extent, with 3.57 million square kilometers. The 2020 extent is 2.49 million square miles (39%) below the 1981 to 2010 average September extent (Figure 2). The satellite record now encompasses 42 years and the last third of the record (14 years) are the lowest 14 years in the record. The linear trend in September extent is -83,700 square kilometers per year, or -13.1% per decade, relative to the 1981–2010 average. Based on the linear trend line, September extent has declined by 44.4% since 1979.
The medians of the Outlook contributions for June, July, and August were 4.33, 4.36, and 4.30 million square kilometers, respectively. None of the months were particularly close to the observed SII in terms of medians and there was little variation in the median between the three months. The August Outlooks closest to the observed extent were from NSIDC (Meier) and the McGill Team (see Figure 3 and 2020 SIO August Report). For the initial June submissions (see 2020 SIO June Report), the closest Outlooks were Simmons and Charles, CPOM, and the Climate Prediction Center. For July (see 2020 SIO July Report), the closest Outlooks were the McGill Team, UTokyo (Kimura et al.), and ANSO IAP-LASG.
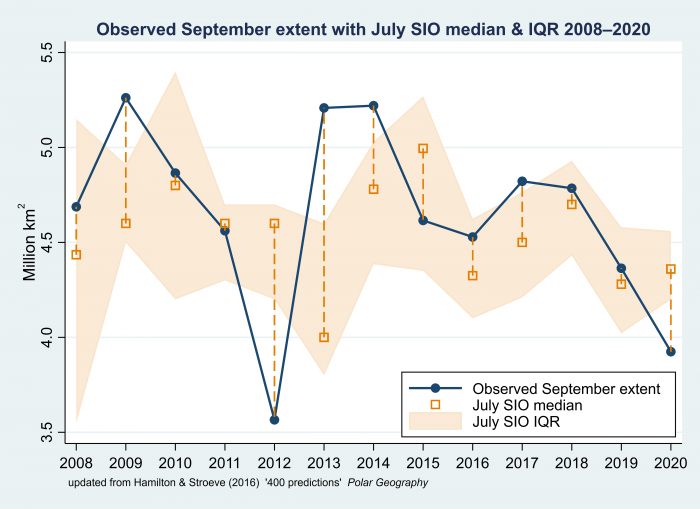
Overall, the interquartile range (IQR) of the forecasts did not vary much over the three months, with a range of 4.06 to 4.6 million square kilometers (Figure 4), so the NSIDC observed September extent was outside the range of the forecasts throughout the Outlook period. This indicates that a shorter forecast interval was not helpful. Part of the reason for this may be the variable ice loss through the summer, with alternating periods of rapid and relatively slow ice loss (see further discussion below). In other words, the lack of a clear trend in the ice loss rates made it difficult for the Outlooks to adjust their forecasts from month to month. This is the first year since 2017 that the observed September extent fell outside the July IQR of the Outlook submissions (Figure 5), and the first time since 2014 that it fell substantially (>100,000 square kilometers) outside the IQR.
Editor's Note: The contribution from UPenn Group (Diebold et al.) to the August report has been corrected here due to an error in the extent calculation instructions. The corrected value for their August contribution is 4.34 million square kilometers.
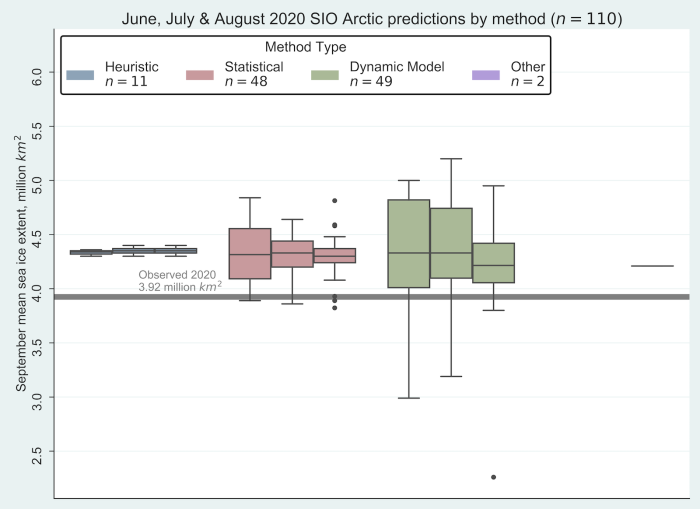
About box plots
As can be seen in Figure 1, September 2020 average ice extent falls well below the long-term trend line. In the past, Outlooks have performed well when the observed extent is near the trend line (Stroeve et al., 2014), but outlier years are more difficult to predict and the performance of Outlooks in such years has generally been less skillful, as we see this year.
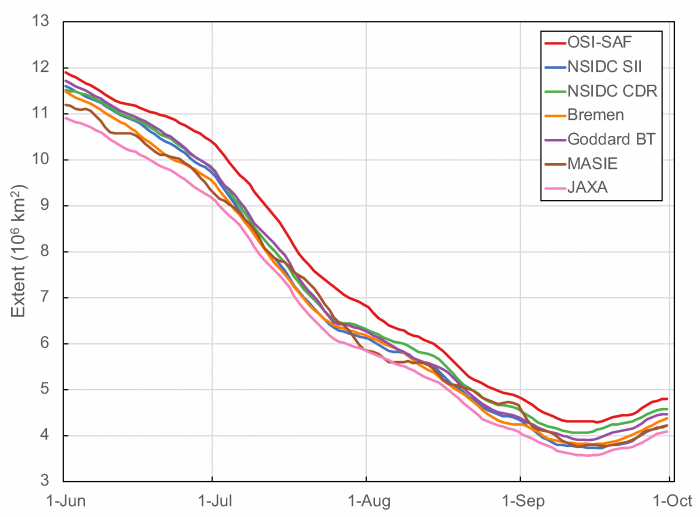
The Sea Ice Outlook uses the NSIDC Sea Ice Index, based on passive microwave sea ice concentrations, as the official metric for sea ice extent. There are other sea ice extent estimates, from passive microwave sensors and other sources. These other products demonstrate a range of values that reflect differences in source, methodology, spatial resolution, and other factors. All products have uncertainties and limitations. Examining the different products provides an indication of the range of observed extent for comparison with the Outlooks.
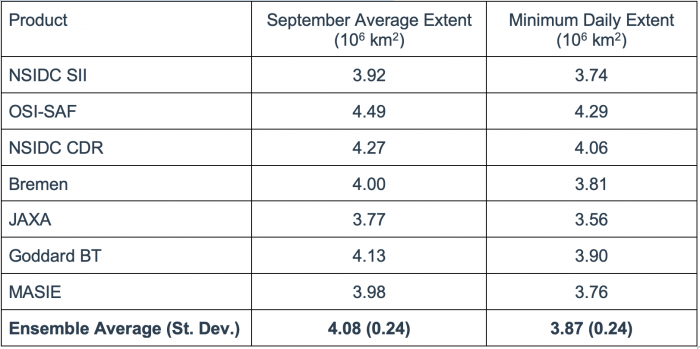
The different products have a range of ~0.5 million square kilometers, with the OSI-SAF and JAXA extent values generally the highest and lowest respectively (Figure 6). While ~0.5 million square kilometers seems large, it generally represents a difference of only 25-50 kilometers in ice edge position around the perimeter of the ice cover. The September monthly average from the seven products is 4.08 million square kilometers (Table 1).
Summer Conditions
The 2020 Arctic sea ice retreat season was marked by extreme conditions. The seasonal June—August 2-meter air temperatures (air temperature at 2 meters above the surface) over Eurasia, Greenland, and the high Canadian Arctic were much above normal (Figure 7). Above normal 2-meter temperatures occurred over the Chukchi, Barents, and Kara Seas. There were positive anomalies on the Atlantic side of the Arctic Ocean and weak or negative anomalies on the Pacific side of the Arctic. The early season, in May and June, was warm, especially over the Siberian sector, where surface air temperatures in Verkhoyansk, Siberia reached 38˚C (100˚F), perhaps the warmest recorded temperature north of the Arctic Circle. This extreme warmth and a pattern of offshore winds opened up the Laptev Sea particularly early, resulting in record low extents in the region as early as June. Overall, Arctic (north of 70 N latitude) 2-meter temperatures were extremely warm throughout the summer. Based on NCEP/NCAR Reanalysis estimates compiled by Zach Labe (Colorado State University), May, July, and August were the warmest of their respective months since 1979; June and September 2020 ranked 2nd and 3rd warmest, respectively. As a whole, for the months May—September, 2020 is the warmest Arctic summer since at least 1979. The region of warmest temperatures varied through the summer (see 5 October 2020 Arctic Sea Ice News & Analysis (ASINA)). May had particularly warm temperatures over central Siberia and the Beaufort Sea. June was marked by the very high temperatures in eastern Siberia (near Verkhoyansk). The July "hot spot" was centered over the North Pole. In August, the warm temperatures were less severe but more widespread, covering most of the Arctic Ocean. It should be noted that the 2-meter air temperature anomalies in Figure 7 are influenced, to some extent, by the presence or absence of sea ice. In the Kara and Laptev Seas, for example, the anomalous open water undoubtedly contributed to the anomalously warm air temperatures near the surface, while the near-normal air temperatures over the Beaufort Sea are consistent with near-normal ice extent. Temperature anomalies aloft (e.g., at 850 hPa, Figure 8) were not as large over the Eurasian shelf seas, although they were as large as 4—5˚C over the central Arctic Ocean.
The seasonal June—August sea level pressure anomalies were positive starting from eastern Canada/Greenland and stretching across the Arctic to western Siberia and anomalously low in Alaska and western Canada (Figure 8). Sea level patterns, like temperature, also shifted from month-to-month in the Arctic (see 5 October 2020 ASINA). The feature that stands out in the seasonal sea level pressure anomaly is the high in the central Arctic and the low over the Kara-Barents seas. This pressure pattern is associated with low-level winds that blew off shore into the Arctic in the Laptev and Kara seas that resulted in the notable retreat of sea ice in the Eurasian Seas (Figure 9). The pressure pattern is also consistent with the southward advection of thicker multiyear ice into the Beaufort Sea, which was one of the few regions with September ice extent close to its historical mean (Figure 2).
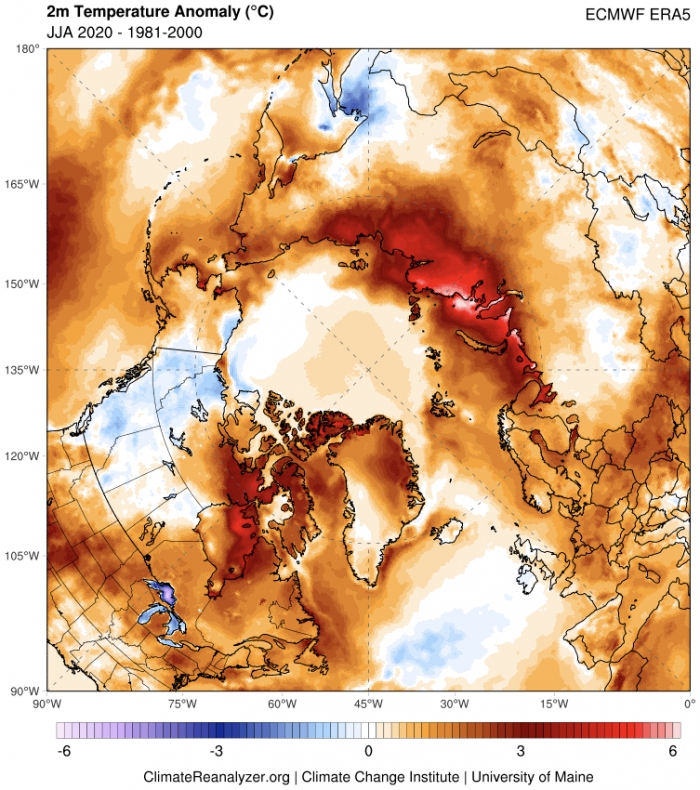
See further ERA5 data and image details from Climate Reanalyzer.
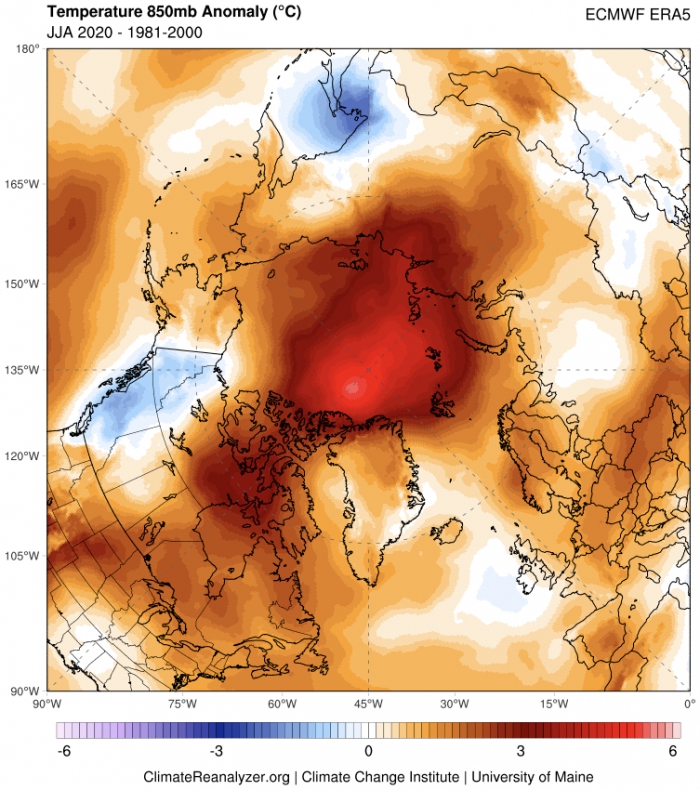
See further ERA5 data and image details from Climate Reanalyzer.
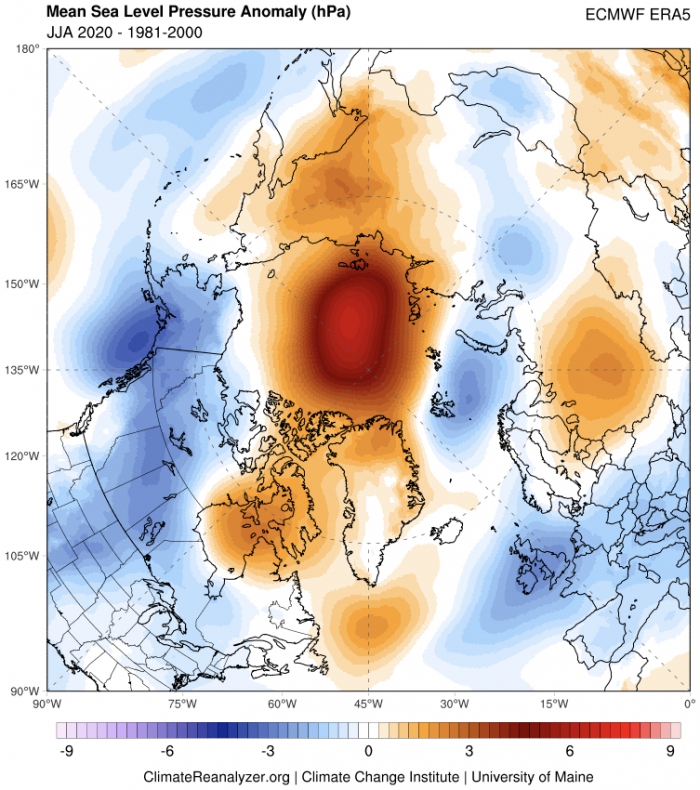
Appendix—Information on Sea-Ice Extent Products
Sea-ice extent estimates were obtained from seven different sources. Most of the extent values are self-reported—i.e., calculated by the organizations and not derived from gridded concentration fields (except for the NOAA/NSIDC CDR, which was calculated from the gridded fields). There may be discrepancies between the products in terms of land masks and quality information. Thus, some of the difference in the products may be due to these discrepancies and not differences in the algorithms. Note also that the spatial resolution affects the precision of the ice edge location and thus affects the total extent.
All products except MASIE, were calculated from sea-ice concentrations based on passive microwave algorithms. The input sensors are either SSMIS or AMSR2. MASIE is an integrated extent field produced by the U.S. National Ice Center (NIC) based on manual analysis of various available products. The table below provides a summary of information on the sources with a link to the product source/documentation.
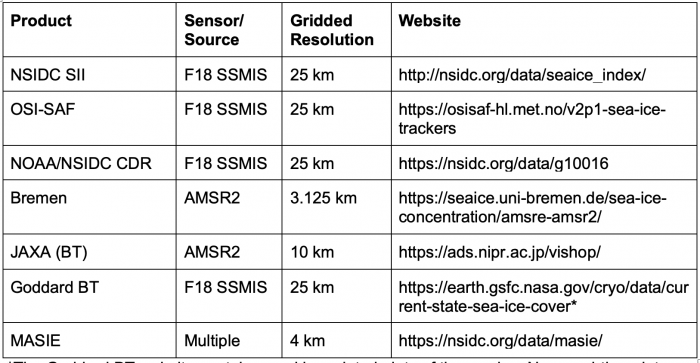
Acronyms:
AMSR2 = Advanced Microwave Scanning Radiometer 2
Bremen = University of Bremen
BT = Bootstrap algorithm
CDR = Climate Data Record
MASIE = Multi-sensor Analyzed Sea Ice Extent
OSI-SAF = Ocean and Sea Ice Satellite Application Facility
SII = Sea Ice Index
SSMIS = Special Sensor Microwave Imager and Sounder
References
Fetterer, F., K. Knowles, W. N. Meier, M. Savoie, and A. K. Windnagel. 2017, updated daily. Sea Ice Index, Version 3. Boulder, Colorado USA. NSIDC: National Snow and Ice Data Center. doi: https://doi.org/10.7265/N5K072F8.
Stroeve et al. 2014). Predicting September Sea Ice: Ensemble Kkill of the SEARCH Sea Ice Outlook 2008–2013. Geophysical Research Letters. doi:https://doi.org/10.1002/2014GL059388.
Report Credits
This 2020 Sea Ice Outlook Interim Post-Season Report was developed by the SIPN2 Leadership Team.
Report Lead:
Walt Meier, National Snow and Ice Data Center
Additional Contributors:
Uma Bhatt, University of Alaska, Geophysical Institute
John Walsh, International Arctic Research Center
Rick Thoman, Alaska Center for Climate Assessment and Policy, International Arctic Research Center, University of Alaska
Editors:
Betsy Turner-Bogren, ARCUS
Helen Wiggins, ARCUS
Lisa Sheffield Guy, ARCUS
Stacey Stoudt, ARCUS
Suggested Citation
Meier, W., U. S. Bhatt, J. Walsh, R. Thoman, P. Bieniek, C. M. Bitz, E. Blanchard-Wrigglesworth, H. Eicken, L. C. Hamilton, M. Hardman, E. Hunke, T. Jung, J. Kurths, J. Little, F. Massonnet, J. E. Overland, M. Serreze, M. Steele, J. Stroeve, M. Wang, and H. V. Wiggins. Editors: Turner-Bogren, B., H. V. Wiggins, and S. Staudt. October 2020. "2020 Sea Ice Outlook Interim Post-Season Report."
Published online at: https://www.arcus.org/sipn/sea-ice-outlook/2020/interim
This Sea Ice Outlook Report is a product of the Sea Ice Prediction Network–Phase 2 (SIPN2), which is supported in part by the National Science Foundation under Grant No. OPP-1748308. Any opinions, findings, and conclusions or recommendations expressed in this material are those of the author(s) and do not necessarily reflect the views of the National Science Foundation.
