The outlook for the pan-arctic sea ice extent in September 2008, based on June data, indicates a continuation of dramatic sea ice loss. The June Sea Ice Outlook report is based on a synthesis of 17 individual projections, utilizing a range of methods. Projections based on June data are similar to those of the May report, with no indication that a return to historical sea ice extent will occur this year.
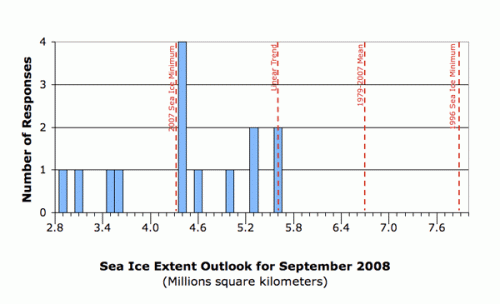
The range of responses were from 2.9 to 5.6 million square kilometers, which is in part due to the relative weight respondents give to "initial conditions" (e.g., age and thickness of sea ice at the end of spring) versus whether summer winds in 2008 will be as supportive for ice loss as was the case in 2007.

Of the 17 responses, all suggest that the extent will remain lower than the historical average (i.e., mean 1979–2000 September values) of 7.0 million square kilometers. Five (5) responses suggested a less dramatic loss than in 2007 (i.e., 4.3 million square kilometers) and closer to the pre-2007 long-term trend of approximately 10% loss per decade. Five (5) anticipate a repeat of the dramatic loss of 2007. Four (4) suggest a loss even greater than that experienced in 2007. Three (3) give more detailed reports on regional trends.
Status
On 27 June 2008 a request was issued to the arctic research community requesting input for the June 2008 Outlook Report on arctic sea ice conditions for September 2008, to update the May Outlook using June data. Responses were obtained with a 7 July cutoff date. The June Sea Ice Outlook report is based on 17 individual responses contributed by the international research community, with 4 new groups contributing. Additional background material is provided in the May Outlook.
Approach and Disclaimer
The Sea Ice Outlook provides a forum for researchers to evaluate their understanding of the state of arctic sea ice and for the community to jointly assess a range of factors that contribute to arctic summer sea ice minima. The Sea Ice Outlook is not a formal consensus forecast or prediction for arctic sea ice extent, nor is it intended as a replacement for existing efforts or centers with operational responsibility.
Results
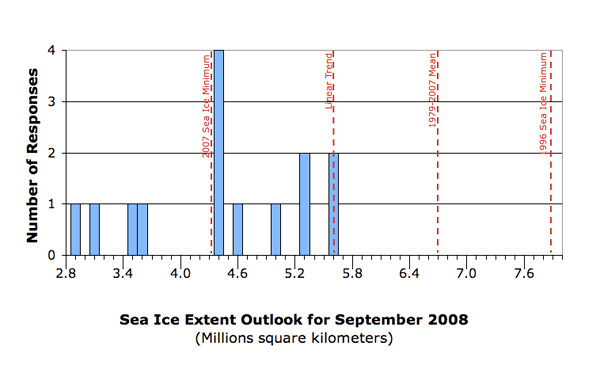
With 17 total responses, 14 provided a value for the arctic sea ice minimum extent for September 2008; 3 provided regional outlooks. The individual responses were based on a range of methods: statistical, numerical models, comparison with previous observations and rates of ice loss, or composites of several approaches; details can be found in the individual outlooks available at the end of this report. The distribution of the responses for how much sea ice will remain in September 2008—based on June data—is shown below.

In summary, for the June Outlook:
Five (5) respondents suggest a return toward the long term trend line of summer sea ice loss, but less than the 1979-2000 mean extents;
Five (5) respondents anticipate the 2008 extent to be close to the 2007 record sea ice minimum; and
Four (4) respondents suggest additional ice loss compared to 2007.
For comparison, the responses from the previous May Outlook were:
Three (3) respondents suggested a return toward the long term trend line of summer sea ice loss;
Six (6) respondents anticipated the 2008 extent to be close to the 2007 record minimum; and
Five (5) respondents suggested additional ice loss compared to the 2007 minimum.
One new group (Arbetter, et al.) had a new lowest value of less than 3.1 million square kilometers. One member's 2008 outlook (Kalaeschke) went from less sea ice to more sea ice compared to 2007; this was based on applying a different method with a stronger weighting for initial conditions. One group (Drobot, et al.) increased their estimate from 3.8 to 4.4 million square kilometers based on June initial conditions. One new member (Hutchings) based her June outlook on a review of May outlooks.
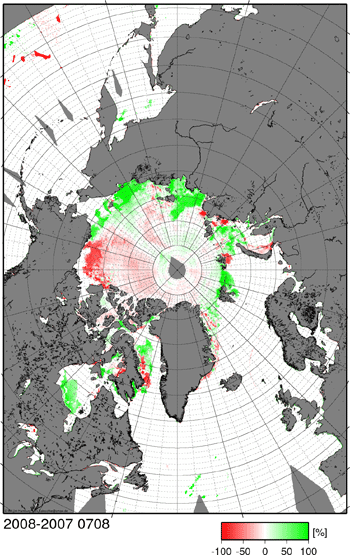
A figure below from Lars Kaleschke shows that as of 8 July there was more sea ice in 2008 in the Chukchi and Laptev Seas and less in the Beaufort Sea compared to the same date in 2007. Ice concentration data are based on AMSR-E products; see http://www.seaice.de. Tom Agnew provided a similar figure.

Two groups (Kauker, et al., and Zhang) ran sea ice models with an ensemble (many years) of summer weather conditions from previous years. If the summer weather in 2008 is a repeat of 2007, there would be less sea ice in September 2008 than in 2007. However, the ensemble mean September 2008 sea ice conditions, using the range of historical summer weather, gives a value of sea ice extent that is slightly more than 2007.
The range of responses (2.9 to 5.6 million square kilometers) illustrates several of the challenges faced by any forecast of arctic summer ice evolution. As noted last month, this range depends in part on the relative weight that the respondents give to "initial conditions," e.g., age and thickness of sea ice at the end of spring, versus whether summer winds in 2008 will be as supportive for ice loss as the favorable winds were in 2007. The results of our survey for June are similar to those from the May report. Even the highest forecast for September 2008 is 1.5 million square kilometers less than the long-term September mean during the 1980s, and the range of individual forecasts is similar to natural variability. Conditions in July will give further clues for potential September sea ice conditions. We will see how summer weather patterns are developing and investigators will have further analyses of ice conditions.
A key uncertainty that filters into several of the outlook contributions is the fate of first-year ice and in particular the extent to which it melts back completely or survives the summer. Data are mixed. North of Greenland/Canada the modal ice thickness is lower by more than a meter (at 2.5 m in 2008) than in 2004–06 because existing multi-year ice is both thinner and of lesser extent. Close to the pole first-year ice in 2008 is comparable to or slightly thicker than first-year ice in 2007. Other in situ and satellite data suggest that even though the seasonal ice cover was formed later in the fall of 2007, the mean thickness of first year ice cover is comparable to that of the previous two seasons because of lower snow accumulation and lower air temperatures and thus, faster growth. Some scenarios assume complete meltback of all first-year sea ice, while others limit meltback to ice classes thinner than a specific threshold (such as 1m). Here, thickness data, which are sorely lacking but available in a few locations as the result of International Polar Year efforts and from satellite-derived estimates of ice age or type, constrain modeled thickness distributions. As for estimates of surface and bottom melt, ice mass-balance observations from drifting sensors and remote sensing data indicate a spatial pattern with total ice melt decreasing from the marginal seas towards the pole. The problem here is that deployment of buoys is highly clustered into areas of thicker multiyear ice because of challenges in deploying buoys on thinner seasonal ice (see http://iabp.apl.washington.edu/maps_daily_map.html).
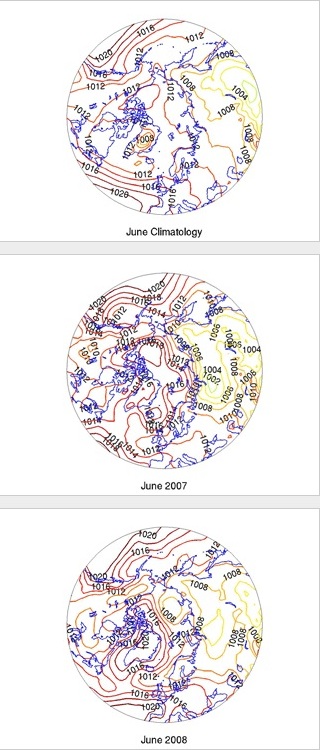
Surface weather patterns are central in driving export, deformation, and compaction of ice, and transporting heat and moisture, and are linked to cloud cover. The figure below (courtesy Cecilia Bitz) shows the sea level pressure field centered over the Northern Hemisphere for June 2008, June 2007, and for June average conditions (climatology). The numbers are pressure values in millibars; regions of high relative pressures are shown in red and regions of low pressure are shown in yellow. Wind-driven sea ice movement roughly follows these contour lines with higher pressures to the right. The climatology field suggests that on average there is not much drift; but in both 2007 and 2008, there is higher pressure on the North American side and lower pressure on the Eurasian side. In 2008, the stronger winds are located more to the North American side and are blowing toward Europe compared to 2007; this pattern is consistent with the shift in ice conditions shown above with more ice on the Siberian side and less in the Beaufort Sea. The June 2008 pressure pattern does suggest some support for sea ice loss in 2008 similar to that of 2007. As indicated by several outlook contributions, persistence of large-scale atmospheric circulation patterns in early/mid-summer helps inform assessments of ice evolution later in summer. At the same time, the range of ensemble simulations from sea ice models mentioned above shows how capricious weather patterns–such as the one observed in 2007–can help drive anomalous ice distribution patterns in any one year.

Key Statements from Individual Outlooks
The following section lists the contributors, their September 2008 outlook based on June data (in million square kilometers), extracts key statements that comment on methods and rationale, and provides a link to their full report. Previous estimates from May outlooks are shown in [ ], with NC=no change. The anticipation for September 2008 sea ice extent responses are divided into three groups: more than the sea ice extent of September 2007, approximately the same sea ice extent, and below the sea ice extent of September 2007. The number at the end of each statement provides a link to the full narration. Note that these outlooks were provided as a method for a semi-quantitative synthesis, and do not imply that sea ice extent can be forecast to this accuracy.
More than the 2007 Sea Ice Minimum Extent
Stern 5.6 [NC]. Method: Combination of models and data.
There is no explicit physical reasoning-the implicit assumption is that whatever factors drove the sea ice extent to decline approximately linearly during 10 Septembers between1997-2006, will continue to operate in September 2008. (15)
Kaleschke 5.6 [3.8]. Method: Daily updated statistical regression based on sea ice concentration derived from 85 GHz SSM/I data.
A different method using 2008 data is presented compared to the May outlook. The auto-correlation of the sea ice area anomaly time series is in the order of three months. Therefore, a skillful prediction of the September ice extent is possible based on the satellite derived sea ice area at the end of June.
Bitz 5.3 [NC]. Method: Statistical, based on observations and coupled climate model. The 29 year observational record of September sea ice extent has zero autocorrelation, zero skew, and only a weak correlation with the extent in the prior June. The June extent in 2008 lies very close to the long term trend. Therefore, my prediction for September 2008 is an extrapolation of the long term trend for September. These statistical relationships are in general agreement with much longer records that are available from the Community Climate System Model version 3, CCSM3.
Agnew 5.3. I tend to agree with Cecilia Bitz and the other more conservative opinions. The high pressure which sat over the Beaufort and Chukchi Sea last summer was the major reason for the large region of open water in the Siberian, Chukchi and Beaufort seas in the summer of 2007. The chance that this will happen again this summer is unlikely. The most recent ice cover shows these regions as still ice covered, unlike last year. There is no indication that the Siberian or Chukchi Seas have opened up as they did last summer.
Kwok 5.0 [NC]. Even though the seasonal ice cover was formed later in the fall of 2007, the mean thickness of the FY ice cover at the end of March seems comparable to that of the previous two seasons because of lower snow accumulation and thus faster growth i.e., higher ice production. The higher latitude seasonal ice cover is also thicker and regions with typically shorter melt seasons can be expected to have a better chance of surviving the summer.
About the Same as the 2007 Sea Ice Minimum Extent:
Zhang 4.6 [4.5]. Method: Numerical Model.
This is based on ensemble predictions starting on 1 July 2008. The ensemble predictions are based on a synthesis of a model, NCEP/NCAR reanalysis data, and satellite ice concentration data. The ensemble consists of seven members, each of which uses a unique set of NCEP/NCAR atmospheric forcing fields from recent years, such that ensemble member 1 uses 2001 NCEP/NCAR forcing, member 2 uses 2002 forcing, and member 7 uses 2007 forcing.
Lindsay 4.4 [4.5]. Method: The G1 predictor.
The area fraction of ice and water is less than 1 m thick.
Pokrovsky 4.4 [NC]. Method: Weather and sea ice trends. Current observing data confirm my previous ice extent forecast. I expect higher ice extent magnitudes (at least 0.1 million km2) in September 2008 than those that occurred in 2007. But, ice coverage will be quite different with account to those of 2007. A more significant ice extent retreat is expected in the Canadian/Alaska sector of Arctic due to enhanced warmer air inflow. In contrast, the Russian sector will demonstrate a more complicated picture. Less ice coverage is expected in the Barents and Kara Seas. In contrast, a stronger ice sheet will be in the Eastern Seas (Laptev and East-Siberian Seas).
Drobot, Maslanik, and Fowler 4.4 [3.8]. Method: Probabilistic statistical model. Compared to last year, the sea-ice extent is similar, but the ice age data indicates that the ice pack is more vulnerable to loss this year. Air temperatures over the last couple of months have been cooler this year than last year.
(AWI)—Kauker, Gerdes, and Karcher 4.4. Method: Numerical Model-Ensemble forced with NCEP/NCAR reanalysis data. The probability that in 2008 the ice extent will fall below the minimum from September 2007 is about 8%; the probability that it will fall below the minimum of 2005 (the second lowest value in the last 20 years) is practically 100%. With a probability of 80% the minimum ice extent in 2008 will be in the range between 4.16 and 4.70 million km2. From further ensemble runs with differing initial conditions we conclude that the initial ice conditions in March can be responsible for a difference of 1-2 million km2 in the monthly mean September sea ice extent. The strong reduction of ice extent in 2007 left large areas to form new ice in winter 2007/2008. Comparatively large areas of rather thin, young ice therefore characterize the situation at the beginning of the melt season in spring 2008. This can be seen in satellite derived first-year ice fractions, e.g. from NIC (see http://www.nsidc.org/arcticseaicenews/), as well as in the model results. Therefore, a model run driven with atmospheric data from 2007, which is started from spring ice conditions in 2008 instead of 2007, leads to an even smaller ice extent.
Less Than the 2007 Sea Ice Minimum Extent
Hutchings 3.6. Method: Observations and Synthesis of May Outlooks. As pointed out by several investigators in the batch of May outlooks, the area of multi-year ice entering summer 2008 is reduced compared to 2007. The extension of this old ice into the coastal seas and marginal ice zone is as low this year as it was at the same time last year. Hence the presence of MY ice at southerly latitudes will not act to increase the minimum sea ice extent from last year's all time low.
Stroeve, Serreze, Meier, Mahoney, and Scambos 3.5 [NC]. Method: Based on survivability rates of various ice age classes through the summer. Analysis of summer conditions to date reveal that the melt began earlier than usual over the western and central Arctic Ocean, helping to set the stage for strong ice losses in this region during summer through the ice-albedo feedback mechanism. Furthermore, sea level pressure patterns are starting to lock into a combination of a dipole pattern (high over Canada, low over Siberian oceans) and a dominant low pressure cell within the Arctic Basin. Both patterns favor reductions in ice extent, especially in the western Arctic. These patterns look to persist for at least the next week. Overall, June 2008 ice extent is now tied with that in 2007.
Rigor, Clemente-Colón, Nghiem, Woods, Brinkley, Arbetter 3.1, [NC]. Method: Based on a buoy drift model that estimates the age of sea ice, QuikSCAT retrievals of ice age classes, and the survival rates of each age class. (full narration can be obtained from http://seaice.apl.washington.edu/Outlook/2008)
(NIC)—Arbetter, Clemente-Colón, Szorc, Holden and Rigor 2.9. Method: First year Ice Scenarios. Four scenarios give a range of 3.1 to 2.4 million km2. In order to asses a range of possible outcomes, a set of 2008 outlooks were produced with various FYI melt scenarios ranging from conservative to extreme. Four cases were considered:
Conservative melt: Most of the FYI survives
Moderate melt: Less FYI bordering open water areas above Fram Strait and above Lomonosov Ridge survives
Aggressive melt: Only FYI packed along the Canadian Arctic Archipelago survives
Extreme melt: No FYI survives
The four (4) outlook scenarios presented here were produced by the NIC Science Team and presented to the Operations Senior Analysts/Forecasters. The opinion of the forecasters was that the most likely scenario was somewhere between Moderate and Aggressive scenarios.
Regional Outlooks
We have three regional outlooks:
Eicken for Alaskan Waters
Passive microwave data (SSM/I) distributed by the National Snow and Ice Data Center (NSIDC) indicate that rapid ice retreat observed in May has slowed down somewhat in June. In the southern Chukchi and eastern East Siberian Sea, the ice edge is near its normal position in late June, while it is much further north than normal in the Beaufort Sea.
Gerland and Goodwin for the Barents Sea and East Greenland
The passive microwave satellite observations do not give information on ice thickness, and here we have only considered ice concentration more than 30% and not taken account of variability of higher ice concentrations. Combining the limitations of this data with the (interannual) variability in atmospheric and oceanic conditions between now and September 2008 leaves a wide range of scenarios open for how sea ice conditions may develop throughout the summer.
Howell for the Northwest Passage
No Changes in the Northwest Passage. The ice is still landfast.
| Attachment | Size |
|---|---|
| Download All Individual June 2008 Outlook Submissions (PDF - 5.8 MB)5.77 MB | 5.77 MB |
| Attachment | Size |
|---|---|
| Agnew344.97 KB | 344.97 KB |
| Arbetter et al.385.87 KB | 385.87 KB |
| Bitz108.1 KB | 108.1 KB |
| Drobot et al.153.58 KB | 153.58 KB |
| Eicken407.08 KB | 407.08 KB |
| Gerland3.69 MB | 3.69 MB |
| Howell46.36 KB | 46.36 KB |
| Hutchings73.02 KB | 73.02 KB |
| Kaleschke230.16 KB | 230.16 KB |
| Kauker et al.941.62 KB | 941.62 KB |
| Kwok36.95 KB | 36.95 KB |
| Lindsay43.99 KB | 43.99 KB |
| Pokrovsky423.69 KB | 423.69 KB |
| Rigor et al.38.57 KB | 38.57 KB |
| Stern61.83 KB | 61.83 KB |
| Stroeve et al.291.43 KB | 291.43 KB |
| Zhang331.92 KB | 331.92 KB |


