Outlook Report
Executive Summary
The Sea Ice Outlook (SIO) is a community network activity led by the Sea Ice Prediction Network-Phase 2 (SIPN2) Project Team with contributions from key partners. SIPN2 is a community of scientists and stakeholders with the goal of advancing our understanding of the state and evolution of Arctic sea-ice cover.
- The observed 2022 September monthly averaged sea-ice extent was 4.87 million square kilometers based on data from the National Snow and Ice Data Center (NSIDC) Sea Ice Index (SII).
- In 2022 for the second year, the SIO included early September initialized forecasts and anomaly forecasts for September mean Arctic sea-ice extent. A total of 117 pan-Arctic September extent forecast submissions in June, July, August, and September were received during the 2022 SIO season.
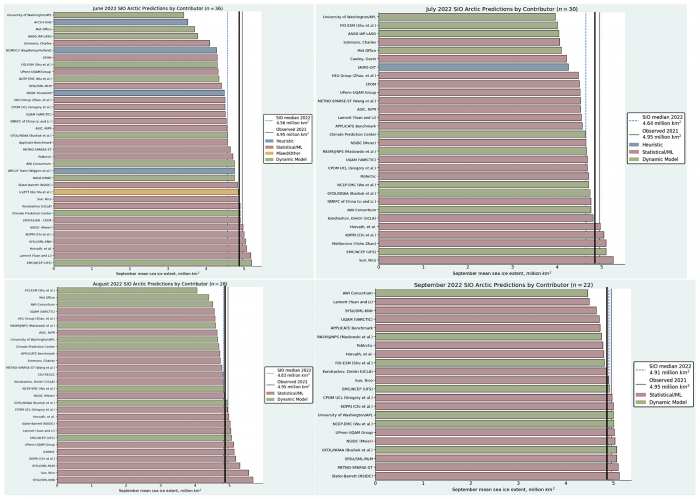
- The August and September medians of SIO contributions of 4.83 and 4.91 million square kilometers, respectively, were closest of all forecast months to the observed September extent of 4.87 million square kilometers. The median increased throughout the forecast season.
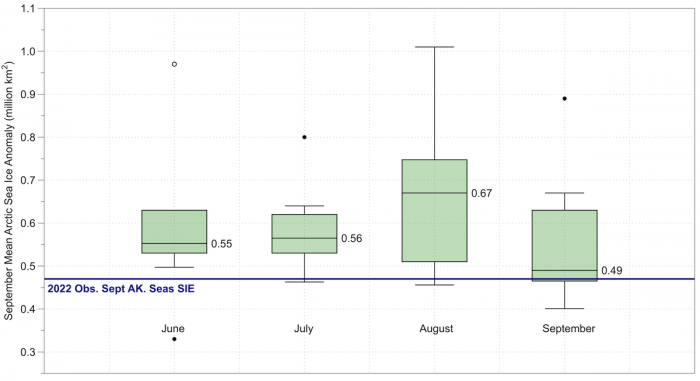
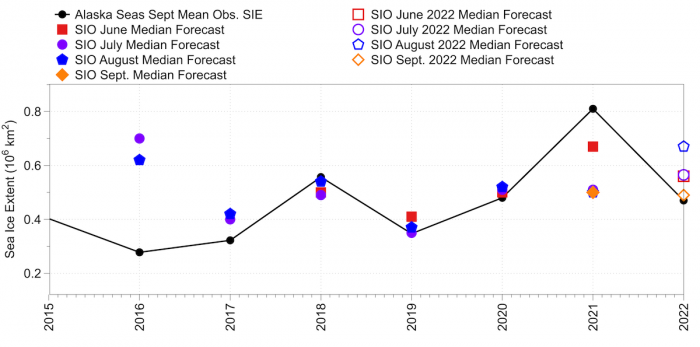
- For the combined Bering, Chukchi, and Beaufort seas, or Alaska Region, the SIO median forecast for June through September was 0.56, 0.56, 0.67, and 0.49 million square kilometers with a 2022 observed value of 0.47 million square kilometers.
- Spatial forecasts of September mean sea ice extent show a consistent improvement from June to September initializations, though some individual forecasts show large errors.
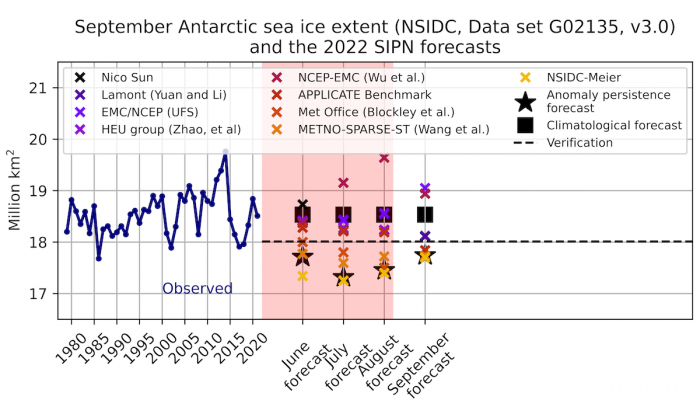
- The Antarctic sea-ice extent reached 18.01 million km2 on average for September 2022, a value which is the fifth lowest on record.
- The SIO partner activity, Sea Ice Drift Forecast Experiment (SIDFEx), received forecasts for September buoy locations in the Arctic submitted by four 2022 SIO contributors. The hit rates for the two buoys which covered smaller-than-usual distances are the highest (47 and 62%), and weather-aware systems outperform other systems, but only at the shortest lead time.
This 2022 Post-Season Sea Ice Outlook Report was developed by lead author Uma Bhatt, University of Alaska Fairbanks, Geophysical Institute (Executive Summary, 2022 Observed Arctic Conditions: Sea Ice-Alaska Seas, 2022 SIO Forecasts: Pan-Arctic and Alaska Seas, Next Steps); Walt Meier, NSIDC (2022 Observed Arctic Conditions: Pan-Arctic Sea-ice and Atmospheric Conditions); Michael Steele, University of Washington (Discussion of Ocean Heat Conditions); François Massonnet, Université Catholique de Louvain (Review of 2022 Antarctic Contributions and Observed Antarctic Conditions); Ed Blanchard-Wrigglesworth, University of Washington (Discussion of 2022 pan-Arctic spatial forecasts); Helge Goessling and Valentin Ludwig, Alfred-Wegener Institute, SIDFEx Team (Discussion of SIDFEx results), Matthew Fisher, NSIDC (statistics and graphs); and Betsy Turner-Bogren and Helen Wiggins, ARCUS (report publication coordination); and the rest of the SIPN2 Project Team.
2022 Observed Arctic Conditions
Sea Ice
Pan-Arctic Sea Ice
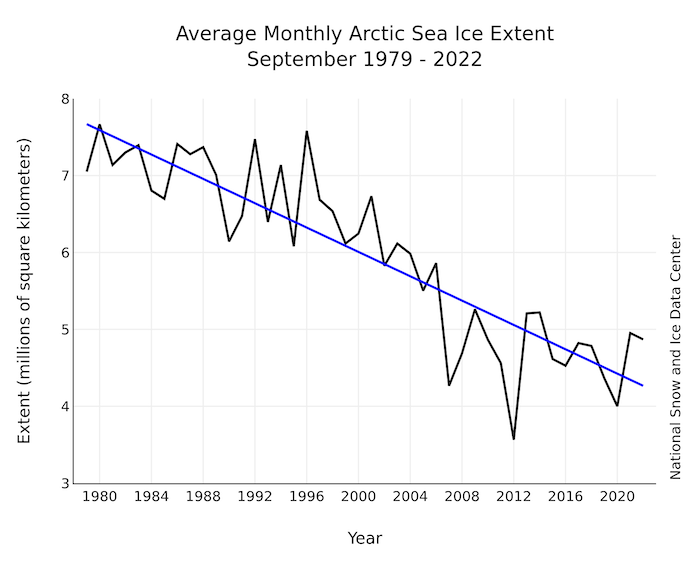
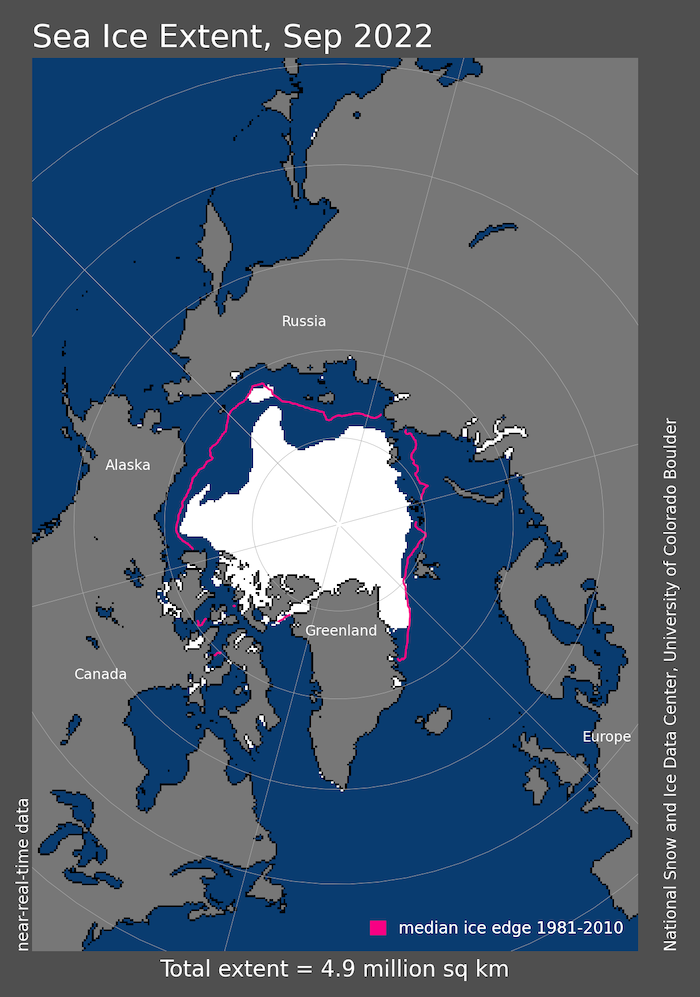
The September 2022 average Arctic sea-ice extent was 4.87 million square kilometers (1.88 million square miles), tying with 2010 for eleventh lowest in the satellite record (Figure 1). This was 1.54 million square kilometers (595,000 square miles) below the 1981 to 2010 average and 1.30 million square kilometers (502,000 square miles) above the lowest September average, in 2012. These values are based on the NSIDC Sea Ice Index (Fetterer et al., 2017) using the NASA Team algorithm passive microwave sea ice concentration products (DiGirolamo et al., 2022; Meier et al., 2021). There are several other sea ice concentration and extent products that have notable differences in extent (e.g., Meier and Stewart, 2019). However, trends and anomalies are more consistent between products (e.g., Comiso et al., 2017).
The September spatial distribution of ice was asymmetrical with much less ice in the Pacific sector of the Arctic while the ice edge in the Atlantic sector was nearer to average, albeit still below average (Figure 2). A notable exception in the Pacific region was a tongue of ice that extended southward toward the coast in the East Siberian Sea; in addition, an "ice island" was separated from that tongue of ice further to the south. Greater ice in the area of this remnant tongue and "island" has been seen in previous years, but was particularly late to melt out this year, which resulted in a relatively late opening of the Northern Sea Route.
For much of the summer, ice loss was slow compared to recent years. For the first time since 2014, the extent briefly fell within the 1981-2010 inter-decile range. However, late season loss was relatively strong, resulting in the 11th lowest September extent in the record. The last 16 years (2007 through 2022) have had the 16 lowest September extents in the 44-year satellite record.
Another notable feature of the summer was the formation of open water areas north of the Kara Sea, at about 87 degrees N latitude - within ~300 km of the pole. As summer ice loss has increased and the ice has thinned, such areas are starting to be seen more commonly in the Arctic at high latitudes. The open water areas started to form in early July and were observed intermittently through the end of August. These unusual polynyas likely opened at least in part because of divergent ice motion, but their formation and general persistence is also an indication of thin, young, and un-compacted ice.
While the Northern Sea Route was slow to open, the Northwest Passage reached the fourth lowest level in the 55-year record (since 1967) of the Canadian Ice Service analyses, according to Steve Howell of Environment and Climate Change Canada. (See NSIDC Arctic Sea Ice News and Analysis for more detail.)
The September ice cover continued to be younger and thinner, based on Tschudi et al. (2019a,b). The extent of multiyear coverage increased some from September 2021 but remained near levels seen since 2006, about 50% below the multi-year extents in the 1980s and 1990s. The oldest ice (>4 years old) showed no rebound and has been less than 300,000 km2 since 2012, compared to 1.5 to 2 million square km in the 1980s and 1990s.
Alaska Region Sea Ice
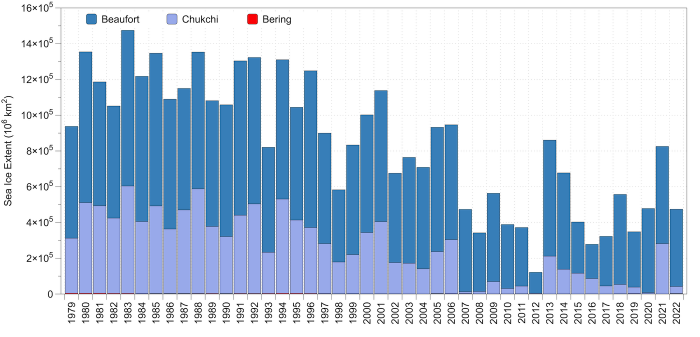
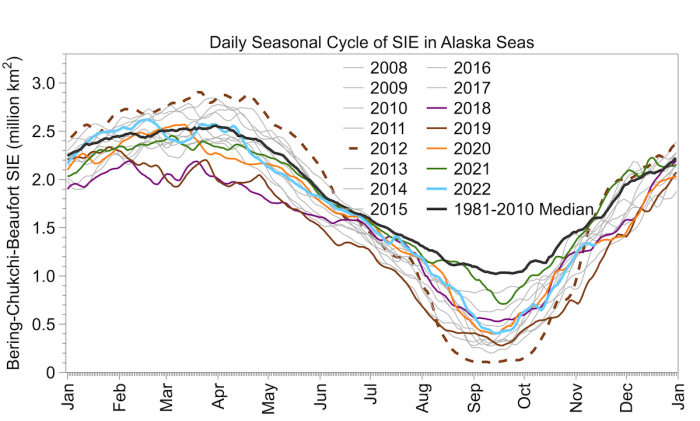
The September mean sea-ice extent for the Alaska Seas was 0.47 million square kilometers ranking 10th lowest over the satellite record (Figure 3). The September mean sea-ice extent in million square kilometers for the Bering Sea was 0.0019 (26th lowest), Chukchi Sea was 0.0404 (11th lowest), and the Beaufort Sea was 0.432 (10th lowest). The 2022 sea-ice extent in the Alaska seas was similar to 2020, except the contribution of the Chukchi in 2020 was lower to the total than in 2022 (Figure 3). The seasonal cycle of daily sea-ice in the Alaska seas in 2022 began with a steep decline in March and then followed a similar path to that of 2020 (Figure 4).
Atmospheric Conditions
During the 2022 summer (June through August), air temperatures at the 925 mb level were above average over the Arctic Ocean, but they were not as extreme as in many recent summers with temperatures largely ranging from 1 to 3 degrees Celsius above average (Figure 5). Only in parts of the Barents Sea did 2022 summer air temperatures reach up to 4 degrees Celsius (7 degrees Fahrenheit) above average. In the southern Chukchi and northern Bering Seas, temperatures were 1 degree Celsius (2 degrees Fahrenheit) below average.
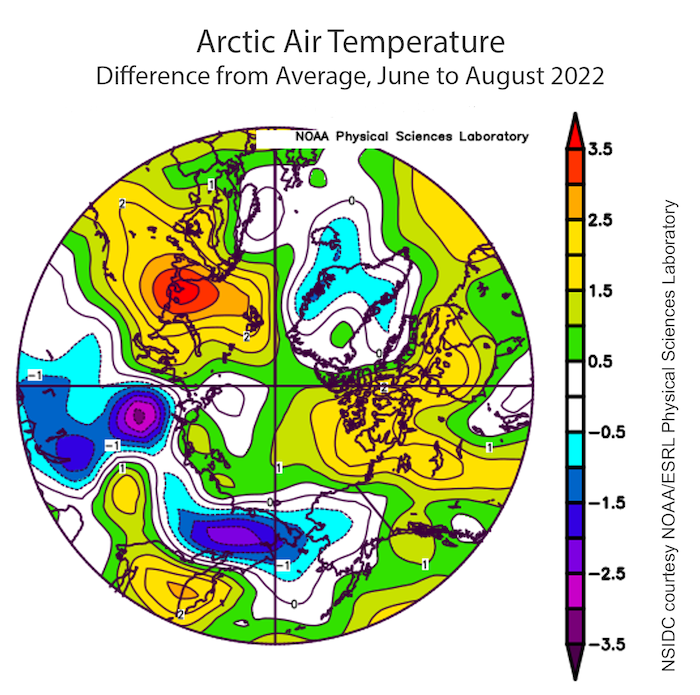
Figure 5 is from the NOAA/ESRL website.
During June through August, average sea level pressure was low over much of the Siberian side of the Arctic, as well as over eastern Canada, and east of Greenland, with a small and weak Beaufort Sea High that primarily manifested itself in June (Figure 6). Summer-averaged pressure gradients were slack, particularly in July and August, albeit with intermittent stronger gradients caused by passing weather systems. Weak pressure gradients resulted in relatively weak surface winds and sea ice circulation through much of the summer.
![Figure 6. Average Arctic sea-level pressure for June to August 2022. Image provided by the NOAA/ESRL Physical Sciences Laboratory, Boulder Colorado ], (Kalnay et al., 1996), adapted by NSIDC. Figure 6. Average Arctic sea-level pressure for June to August 2022. Image provided by the NOAA/ESRL Physical Sciences Laboratory, Boulder Colorado ], (Kalnay et al., 1996), adapted by NSIDC.](/files/sio/33744/2022_sio_postseason_figure_6_slp_jja.png)
Figure 6 is from the NOAA/ESRL website.
Oceanic Heat
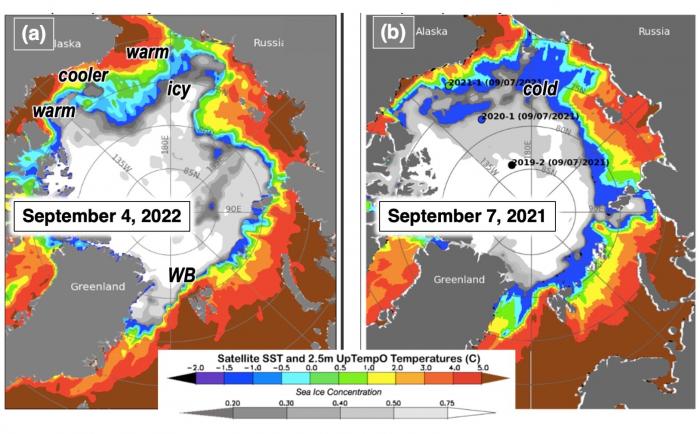
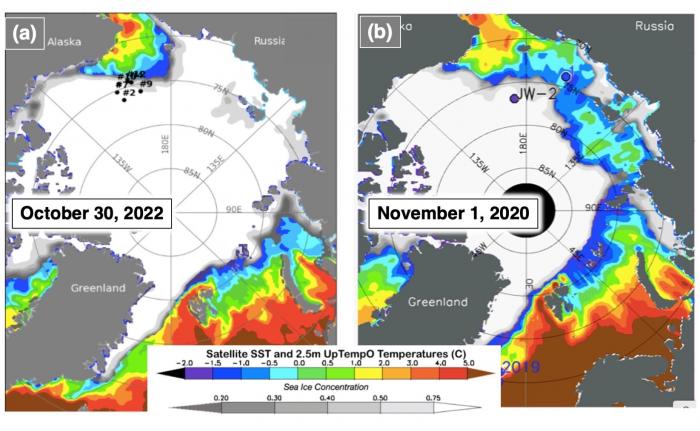
Given the generally icy conditions in summer 2022, Arctic sea surface temperatures (SSTs) were not particularly warm relative to recent years. The Beaufort and northern Chukchi Seas experienced a typical melt-back, with earlier sea ice retreat in the northern Chukchi and eastern Beaufort, relative to later ice retreat in the western Beaufort north of Alaska. This led to an early September SST pattern along this line (Figure 7a) of warm (eastern Beaufort), cooler (western Beaufort), and warm (northern Chukchi). To the north, late season ice retreat led to cool waters up to ~ 78N. Ice remained in the East Siberian Sea at the end of summer ("icy" in Figure 7a), while in the previous year it had very recently melted, leaving near-freezing water in the area ("cold" in Figure 7b). Every year is different, of course, but very commonly ice retreats late in the western Beaufort, East Siberian Sea, and north of the Taymyr Peninsula (between the Kara and Laptev Seas), leaving cooler SSTs in its wake by the end of summer.
The Laptev Sea is a site of early ice retreat and warm SSTs most every summer, owing in part to thin ice created by northerly winds. In 2022, the extension of this warm open water toward the northeast was somewhat anomalous, showing up as a site of particularly strongly positive SST anomalies (see Figure 16 in the September 2022 SIO report). The factors that influence end-of-summer SSTs in this area include the timing of ice retreat, warm air and possibly aerosol-laden northerly advection from Siberia, and the cloud cover. The latter is becoming more important in recent years (Sledd et al., 2022).
The advection of warm Atlantic Water influences SSTs in the Barents and Kara Seas. In 2022, SSTs were a bit warmer than in the previous year (Figure 7), although not dramatically so. Atlantic Water enters this area in two streams: via the Barents Sea north of Norway and via eastern Fram Strait and then eastward along the northern edge of the Barents and Kara Seas. North of Svalbard, this warm water typically induces open water even in winter, a phenomenon sometimes called "Whaler's Bay" ("WB" in Figure 7a). We note that in 2022 this warm water extended farther eastward than in most recent years (compare with last year in Figure 7b). This may be an indicator of enhanced intrusion of Atlantic influence into the Arctic Ocean.
Given the relatively late ice retreat and resulting cool-to-normal SSTs by the end of summer, it is perhaps not surprising that by the end of October, ice advance to the coast was nearly complete in many areas of the Arctic Ocean (Figure 8a). This can be contrasted with the situation in 2020 (Figure 8b), when large open water areas with SSTs above freezing still remained in the East Siberian and Laptev Seas. Note the presence of landfast ice along much of this coast in 2020 (and also in the eastern Kara Sea), which grows northward even as the pack ice slowly advances southward.
2022 SIO Forecasts
Pan-Arctic Forecasts and Pan-Arctic Sea-ice Extent Anomalies
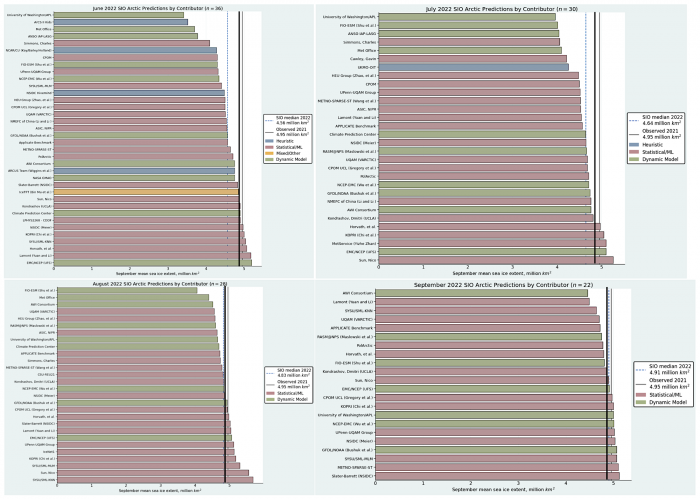
The June, July, August, and September medians of the SIO contributions were 4.57, 4.64, 4.83, and 4.91 million square kilometers, respectively (Figure 9). The monthly median Outlooks in 2022 generally increased over the season. The contributions for all months bracketed the observed Sea Ice Index of 4.87 million square kilometers (Black line in Figure 9), resulting in a median forecast that was lower than observed for all forecast months except September.
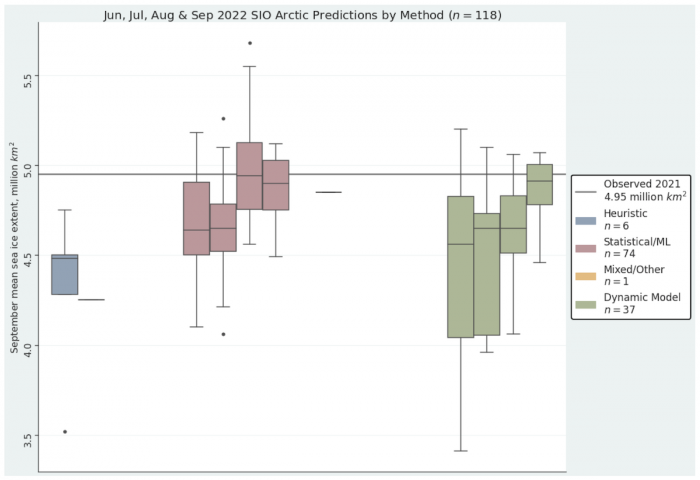
The interquartile range (IQR) for the dynamical models (Figure 10) decreased from June to September while that for the statistical models did not show a clear trend over the season. The observed 2022 September mean sea ice extent was within the interquartile range (IQR) in August and September for statistical predictions and in September for dynamical predictions.
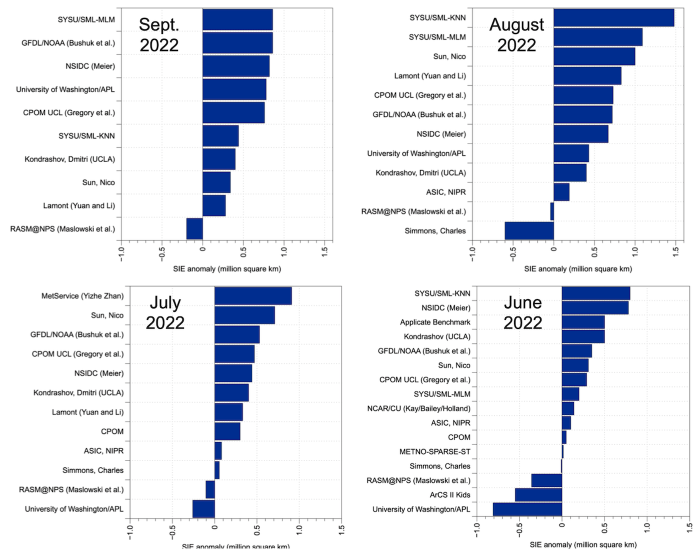
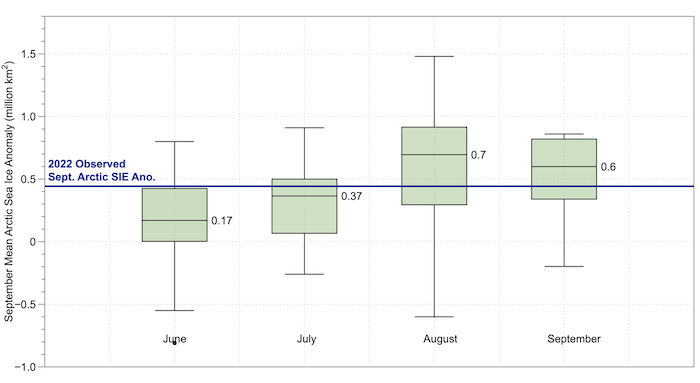
The pan-Arctic sea-ice extent anomaly is the departure of the contributors' September extent Outlook relative to the contributors' baseline trend. While this definition adds uncertainty, it was chosen to let the broadest group of contributors participate in anomaly forecasts. A comparison of anomaly forecasts was motivated by the large spread in SIO contributions, which was hypothesized to be dominated by differences in model sea-ice extent biases. There were 16 (June), 12 (July and August), and 10 (September) contributions for anomaly forecasts for pan-Arctic sea-ice extent (Figure 11). The SIO anomaly forecast had median values of 0.17, 0.365, 0.695, and 0.6 million square kilometers in June, July, August, and September, respectively (Figure 12). The median forecasts bracket the observed September 2022 anomaly sea ice extent of 0.44 million square kilometers. The September SIO anomaly forecasts had standard deviations in million square kilometers of 0.33 in September, 0.53 in August, 0.32 in July and 0.42 in June. The June, July, and September interquartile range contained the observed September mean sea-ice extent anomaly of 0.44 million square kilometers (Figure 12). In 2022, the Interquartile Range (IQR) in all SIO contribution months was located in the region of positive SIE anomalies (Figure 12).
Alaska Seas
This year we again invited participants to submit forecasts of sea-ice extent for the Alaskan region, defined as the combination of the Bering, Chukchi, and Beaufort seas. We received 9 forecasts in June, 8 in July, 8 in August, and 7 in September. Among these, 21 forecast inputs were based on statistical methods, and another 11 were based on dynamical models. For the Alaska region, the SIO median forecast for June through September was 0.56, 0.56, 0.67, and 0.49 million square kilometers, respectively, which were all greater than the observed sea-ice extent of 0.47 million square kilometers (Figure 13). The observed 2022 value crosses the monthly forecast interquartile range in September only (Figure 14). Figure 15 places the 2022 SIO Alaska predictions in the context of past predictions from 2016-2022. The 2022 predictions edged closer to the observed value over the course of the summer season.
Pan-Arctic Spatial Forecasts
In the 2022 SIOs, we received 33 forecasts of Sea Ice Probability (8 in June, 9 in July and August, 7 in September). We have calculated the Spatial Probability Score (SPS, Goessling and Jung 2018), which is the area-integrated Brier Score (note in past years we have shown the pan-Arctic area-averaged Brier Score). Figure 16 shows the SPS scores for 2022 for all SIP forecasts, the multi-model mean SIP forecast, and the SPS for a linear trend SIP forecast.
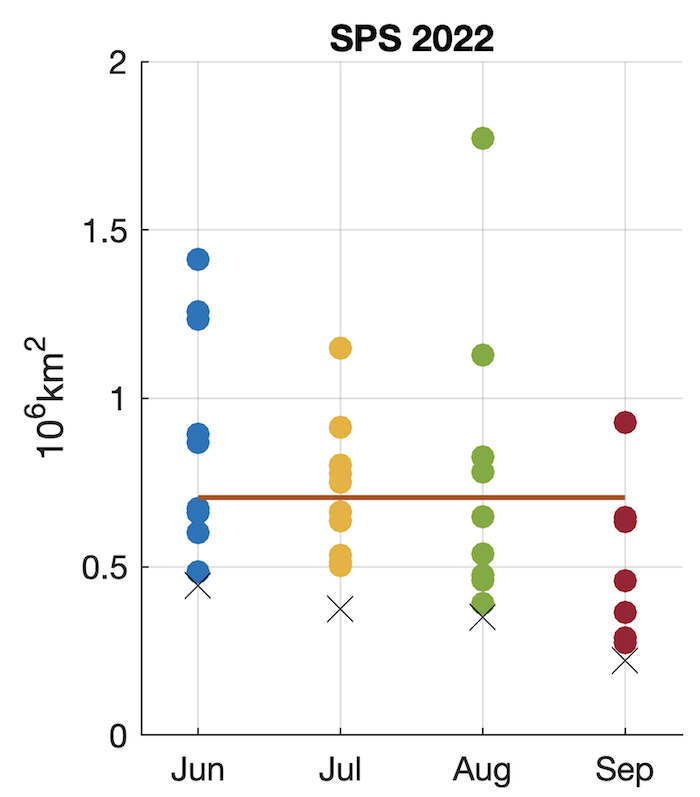
SPS values for individual models range from 0.5-1.5 million square kilometers in June forecasts to 0.3-0.9 million square kilometers in September forecasts. For all four SIO initializations, the multi-model forecast is more skilled than any of the individual forecasts, a feature observed in past years. This shows the value of having a multi-model forecast ensemble. The forecasts also show a consistent improvement from June to September initializations, yet there are still individual forecasts that show large SPS and the worst skilled forecasts still struggle to beat climatology even in September.
Antarctic Forecasts
According to the NSIDC sea ice index, Antarctic sea-ice extent reached 18.01 million square kilometers on average for September 2022 (Figure 17). This value is the fifth lowest on record. The majority of the contributing groups had predicted below-average conditions since June. A few groups had even predicted that a record low would be broken, which did not happen. The results highlight that, for the average sea ice extent metric, dynamical models tend to exhibit larger biases than statistical models. We note that dynamical models are often not bias corrected.
Sea Ice Drift Forecast Experiment (SIDFEx)
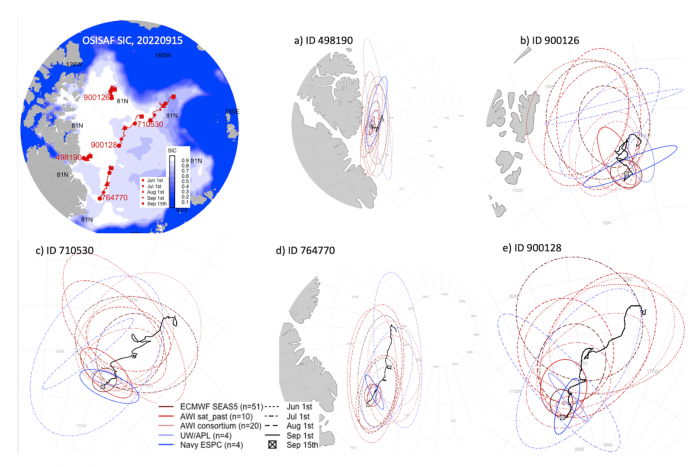
In the framework of the Sea Ice Drift Forecast Experiment (SIDFEx), we have been collecting lagrangian drift forecasts for the trajectories of Arctic and Antarctic buoys since 2017. Forecasts are submitted by 13 groups. In this contribution, we assess the forecast skill of four dynamical models (AWI Consortium, University of Washington/APL, Navy ESPC and ECMWF SEAS5) that also contributed to the SIO. The fifth forecast (AWI sat_past) is based on the last ten years' sea-ice drift fields as observed by satellites and serves as climatological benchmark. All forecasts consist of several ensemble members (see legend of Fig. 18 for the ensemble size).
We select a set of five buoys distributed relatively evenly over the regions which are still ice-covered by mid-September (Figure 18). For these buoys, we investigate forecasts initialized on June, July, August and September 1st, in line with the SIO submissions. For Navy ESPC, only forecasts from September 1st are used as its lead time is not long enough to consider earlier initializations. We fit a 2D gaussian probability distribution to each forecast ensemble. The ellipses in Figure 18 display the 90% quantile of this distribution. This means that, if the ensemble is reliable, there should be a 90% chance that the position of the buoy is within the respective ellipse. We use this to define a hit rate as the metric for our assessment: the fraction of forecasts for which the buoy position lies within the 90% ellipse.
The ellipses of the buoys close to land (498190 and 764770) tend to be more eccentric than the others. We attribute this to the prevailing drift regimes in these regions, namely the drift parallel to the coast for buoy 498190 and the Transpolar Drift for buoy 764770. In regions with less dominant drift patterns, the ensemble spread is larger and more isotropic. Not surprisingly, the area which is covered by the ellipses is smaller for later initialization times, reflecting the growth of uncertainty with lead time.
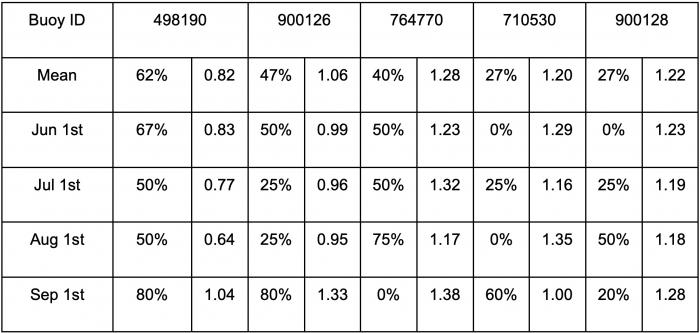
The hit rates for the five buoys range from 62% for buoy 498190 (Figure 18a) to 27% for buoy 900128 (Figure 18e), with an average of 41% for all buoys. This is less than we found in previous years. It is noteworthy that the hit rates for the two buoys which covered comparably small distances (900126, 498190) are the highest (47 and 62%) while those of the other buoys which covered longer distances are lower (40, 27 and 27%, see Table 1).
Comparing the distance the buoys covered this year with the distances they would have covered in the previous ten years (the climatological benchmark AWI sat_past), we find that the buoys with high hit rates are those that covered particularly short distances compared to the climatological benchmark, and vice versa (see Table 1).
Hit rates for the forecasts initialized until August do not exhibit significant model differences. Initializations from September 1st exhibit higher hit rates for ECMWF and Navy ESPC (60 and 80%) than for, e.g., AWI Consortium (40%). This can be explained by how these models handle the atmosphere: while ECMWF and Navy ESPC are coupled models with initialized atmosphere and thereby "weather-aware", AWI Consortium is forced with reanalysis data from past years. The advantage of atmospheric initialization however declines at the timescale of atmospheric predictability.
Note that a high hit rate does not necessarily imply a skillful forecast, but could also originate from overdispersion. However, we find that the location error of the ensemble centroid is smaller for the buoys with higher hit rates (not shown), which justifies focusing on the hit rate.
Next Steps
This postseason SIO report marks the end of another boreal summer and the 2022 mean Arctic September sea-ice extent is now a part of our climate history. As we look ahead, the future of the SIO network is in flux as the SIPN2 project is ending and we await a decision on a submitted proposal for SIPN3. We will of course share any news with the community as soon as we hear. We heartily thank the SIO community for their active and generous participation in this endeavor and without the community this network would not have been such a success. At the 2021 Contributors Forum, the community communicated that they wanted this network to continue and the SIPN team is doing its best to make that happen.
Seasonal forecasting is one of the most challenging problems that climate scientists face and it requires diverse skill sets that can be galvanized through a network to create new knowledge. We should also keep in mind that progress on seasonal forecasting is incremental and acknowledging this guides our expectations of success to be realistic.
The SIO network has matured to a level that it is ready for new challenges. One activity that has emerged is the apples-to-apples SIO forecast evaluation led by Mitch Bushuk of GFDL. This activity has submissions from 17 statistical models, 16 dynamical models, and 1 heuristic prediction. The predictions of September sea-ice span the 2001-2020 period and will evaluate Pan-Arctic SIE, regional SIE, sea ice concentration, initial conditions, and ensembles. The initial analysis has already revealed new insights and we look forward to finalizing and sharing the complete results.
There are two manuscripts being developed, one that evaluates the skill of the SIO over 2008-2022 and another that describes the development of the SIO network and discusses the lessons learned that were only possible because of the network. One example is the diffusion of ideas from economics that were used to create competitive SIO predictions (Diebold and Gobel 2022). SIO community members with an interest in contributing to the network story should contact Uma Bhatt (usbhatt [at] alaska.edu).
We thank the Sea Ice Outlook community for contributing to another season and look forward to the 2023 season.
References
Comiso, J.C., W.N. Meier, and R. Gersten, 2017. Variability and trends in the Arctic sea-ice cover: Results from different techniques J. Geophys. Res., 122, 6883-6900, https://doi.org/10.1002/2017JC012768
Diebold, F. X., & Rudebusch, G. D. (2022). Probability assessments of an ice-free Arctic: Comparing statistical and climate model projections. Journal of Econometrics, 231(2), 520-534.
DiGirolamo, N., C. L. Parkinson, D. J. Cavalieri, P. Gloersen, and H. J. Zwally. (2022). Sea Ice Concentrations from Nimbus-7 SMMR and DMSP SSM/I-SSMIS Passive Microwave Data, Version 2 [Data Set]. Boulder, Colorado USA. NASA National Snow and Ice Data Center Distributed Active Archive Center. https://doi.org/10.5067/MPYG15WAA4WX
Fetterer, F., K. Knowles, W. N. Meier, M. Savoie, and A. K. Windnagel. (2017). Sea Ice Index, Version 3 [Data Set]. Boulder, Colorado USA. National Snow and Ice Data Center. https://doi.org/10.7265/N5K072F8
Kalnay, E., et al. (1996) The NCEP/NCAR 40-Year Reanalysis Project. Bulletin of the American Meteorological Society,77,437-471. https://doi.org/10.1175/1520-0477(1996)077%3C0437:TNYRP%3E2.0.CO;2
Lavergne, T., Sørensen, A. M., Kern, S., Tonboe, R., Notz, D., Aaboe, S., Bell, L., Dybkjær, G., Eastwood, S., Gabarro, C., Heygster, G., Killie, M. A., Brandt Kreiner, M., Lavelle, J., Saldo, R., Sandven, S., and Pedersen, L. T.: Version 2 of the EUMETSAT OSI SAF and ESA CCI sea-ice concentration climate data records, The Cryosphere, 13, 49–78, https://doi.org/10.5194/tc-13-49-2019, 2019
Meier, W.N., and J.S. Stewart, 2019. Assessing uncertainties in sea ice extent climate indicators, Env. Res. Letters, 14, 035005, https://doi.org/10.1088/1748-9326/aaf52c
Meier, W. N., J. S. Stewart, H. Wilcox, M. A. Hardman, and D. J. Scott. (2021). Near-Real-Time DMSP SSMIS Daily Polar Gridded Sea Ice Concentrations, Version 2 [Data Set]. Boulder, Colorado USA. NASA National Snow and Ice Data Center Distributed Active Archive Center. https://doi.org/10.5067/YTTHO2FJQ97K
Sledd, A., T. S. L'Ecuyer, J. E. Kay, and M. Steele, (2022) Clouds increasingly influence Arctic sea surface temperatures as CO2 rises, Geophys. Res. Lett., in review..
Tschudi, M., W. N. Meier, J. S. Stewart, C. Fowler, and J. Maslanik. (2019a). EASE-Grid Sea Ice Age, Version 4 [Data Set]. Boulder, Colorado USA. NASA National Snow and Ice Data Center Distributed Active Archive Center. https://doi.org/10.5067/UTAV7490FEPB
Tschudi, M., W. N. Meier, and J. S. Stewart. (2019b). Quicklook Arctic Weekly EASE-Grid Sea Ice Age, Version 1 [Data Set]. Boulder, Colorado USA. NASA National Snow and Ice Data Center Distributed Active Archive Center. https://doi.org/10.5067/2XXGZY3DUGNQ
Report Credits
This report was developed by the SIPN2 Leadership Team.
Report Lead:
Uma Bhatt, University of Alaska Fairbanks, Geophysical Institute
Additional Contributors:
Matthew Fisher and the NSIDC Development Team, Cooperative Institute for Research in Environmental Sciences at the University of Colorado Boulder, NSIDC
Editors:
Betsy Turner-Bogren, ARCUS
Helen Wiggins, ARCUS
Suggested Citation:
Bhatt, U.S., W. Meier, E. Blanchard-Wrigglesworth, F. Massonnet, H. Goessling, V. Ludwig, P. Bieniek, H. Eicken, M. Fisher, L. C. Hamilton, J. Little, J.E. Overland, M. Serreze, M. Steele, J. Stroeve, J. Walsh, M. Wang, and H. V. Wiggins. Editors: Turner-Bogren, B., and H. V. Wiggins. December 2022. "Sea Ice Outlook: 2022 Post Season Report." (Published online at: https://www.arcus.org/sipn/sea-ice-outlook/2022/postseason)
This Sea Ice Outlook Report is a product of the Sea Ice Prediction Network–Phase 2 (SIPN2), which is supported in part by the National Science Foundation under Grant No. OPP-1748308. Any opinions, findings, and conclusions or recommendations expressed in this material are those of the author(s) and do not necessarily reflect the views of the National Science Foundation.
