
POST-SEASON REPORT
HIGHLIGHTS & TAKE-HOME POINTS
Loss of summer Arctic sea ice took a pause in 2013 with September 2013 having the 6th lowest extent since satellite observations began in 1979: 5.4 million square kilometers, based on National Snow and Ice Data Center (NSIDC) estimates. The seven lowest minimum ice extents have occurred in the last seven years, 2007-2013.
This value compares to record low values in 2007 at 4.3 million square kilometers, 4.6 million square kilometers in 2011 and 3.6 million square kilometers in 2012.
In contrast to the 2012 Outlook when individual Outlook estimates in the June and July reports were higher than the observed September Arctic sea ice extent, all but one estimate were lower than observed in 2013.
Summer weather was cool relative to the last five years with low pressure systems over the central Arctic typical of the long term (30 year) average.
The amount of first-year sea ice continues to increase, accounting for 78% of the ice cover in March 2013. Thus, despite the higher September 2013 sea ice extent relative to the previous five years, the Arctic is primed for continued summer sea ice loss with large interannual variability.
34 groups contributed pan-arctic or regional outlooks this season!
INTRODUCTION
We appreciate the ongoing contributions by all participants and reviewers in 2013. The SEARCH Sea Ice Outlook provides a forum for researchers to contribute their understanding of the state of arctic sea ice and for the community to jointly assess a range of factors that contribute to arctic summer sea ice minima. The Sea Ice Outlook is not a formal forecast, nor is it intended as a replacement for existing efforts or centers with operational responsibility. Additional background material about the Outlook effort can be found on the background page. With funding support from a number of agencies, a Sea Ice Prediction Network (SIPN) is being assembled to provide additional resources and a forum for discussion and synthesis (see the SIPN website).
DISCUSSION AND LESSONS FROM 2013
The sea ice monthly extent for September 2013 was 5.4 million square kilometers, based on National Snow and Ice Data Center (NSIDC) estimates, above the values for the previous three years (Figure 1). It should be noted that this number represents a monthly average and is dependent on a particular passive microwave algorithm to derive ice concentration (see the CliC Arctic Sea Ice Working Group note on the accuracy of satellite-derived passive microwave estimates of sea ice extent).

Image Source: http:/nsidc.org/arcticseaicenews/index.html
While sea ice was more extensive in 2013 than in other recent years, it fits into range of variability characteristic of the time period 2007-2011 with a similar path of summer ice evolution as 2009 (Figure 2). Summer was characterized by climatologically normal low pressure over the Arctic Ocean (Figure 3a), which limited heat import from the south and resulted in average to below normal temperatures over much of the Ocean (Figure 3b).
. The solid gray line indicates average extent from 1979 to 2000. National Snow and Ice Data Center (NSIDC).")
Image Source: http:/nsidc.org/arcticseaicenews/index.html


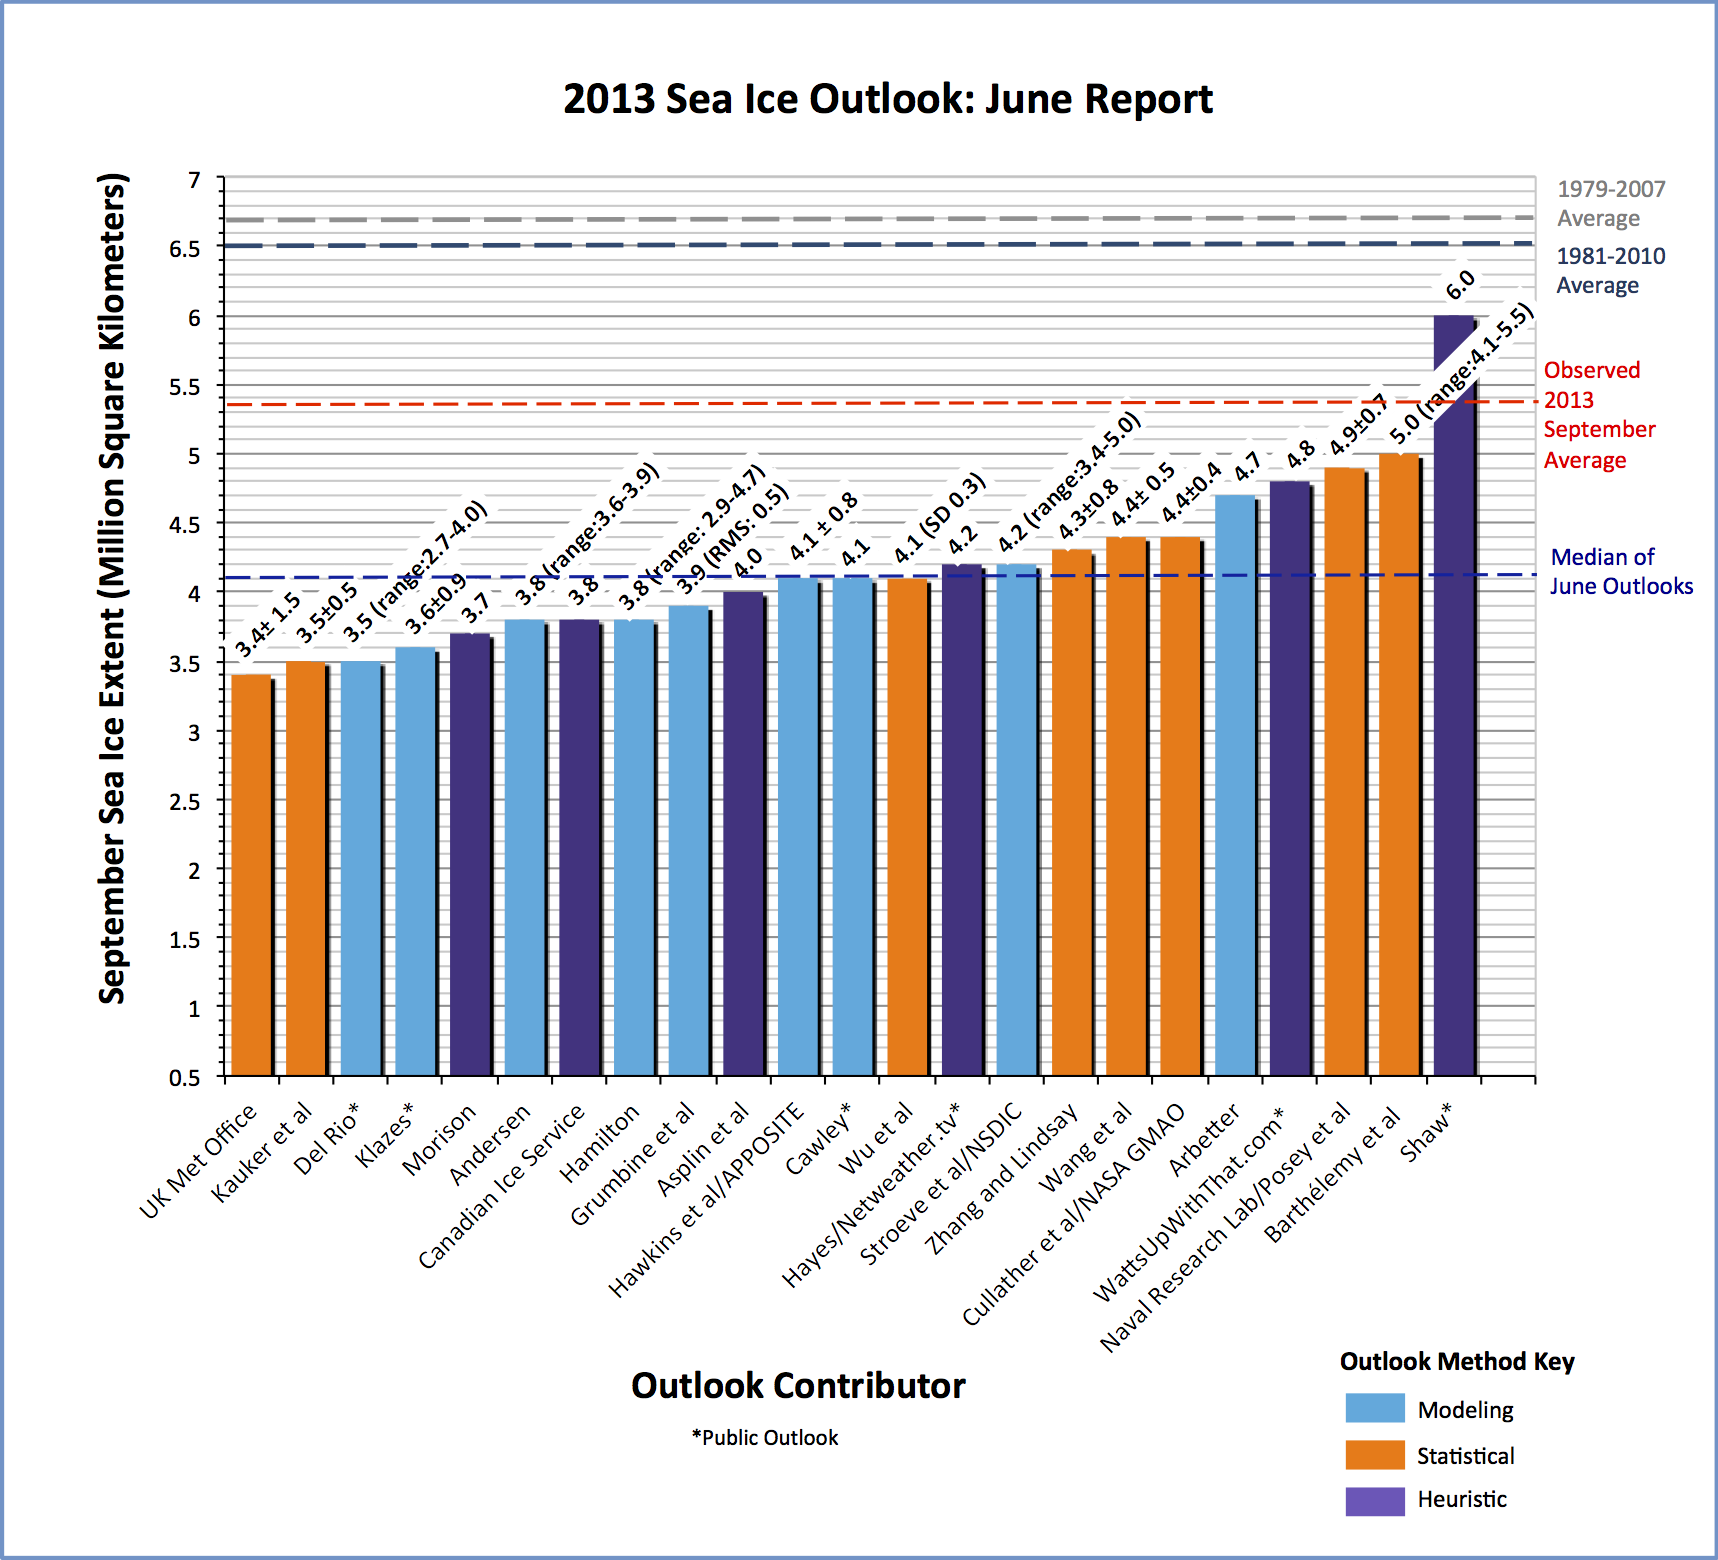
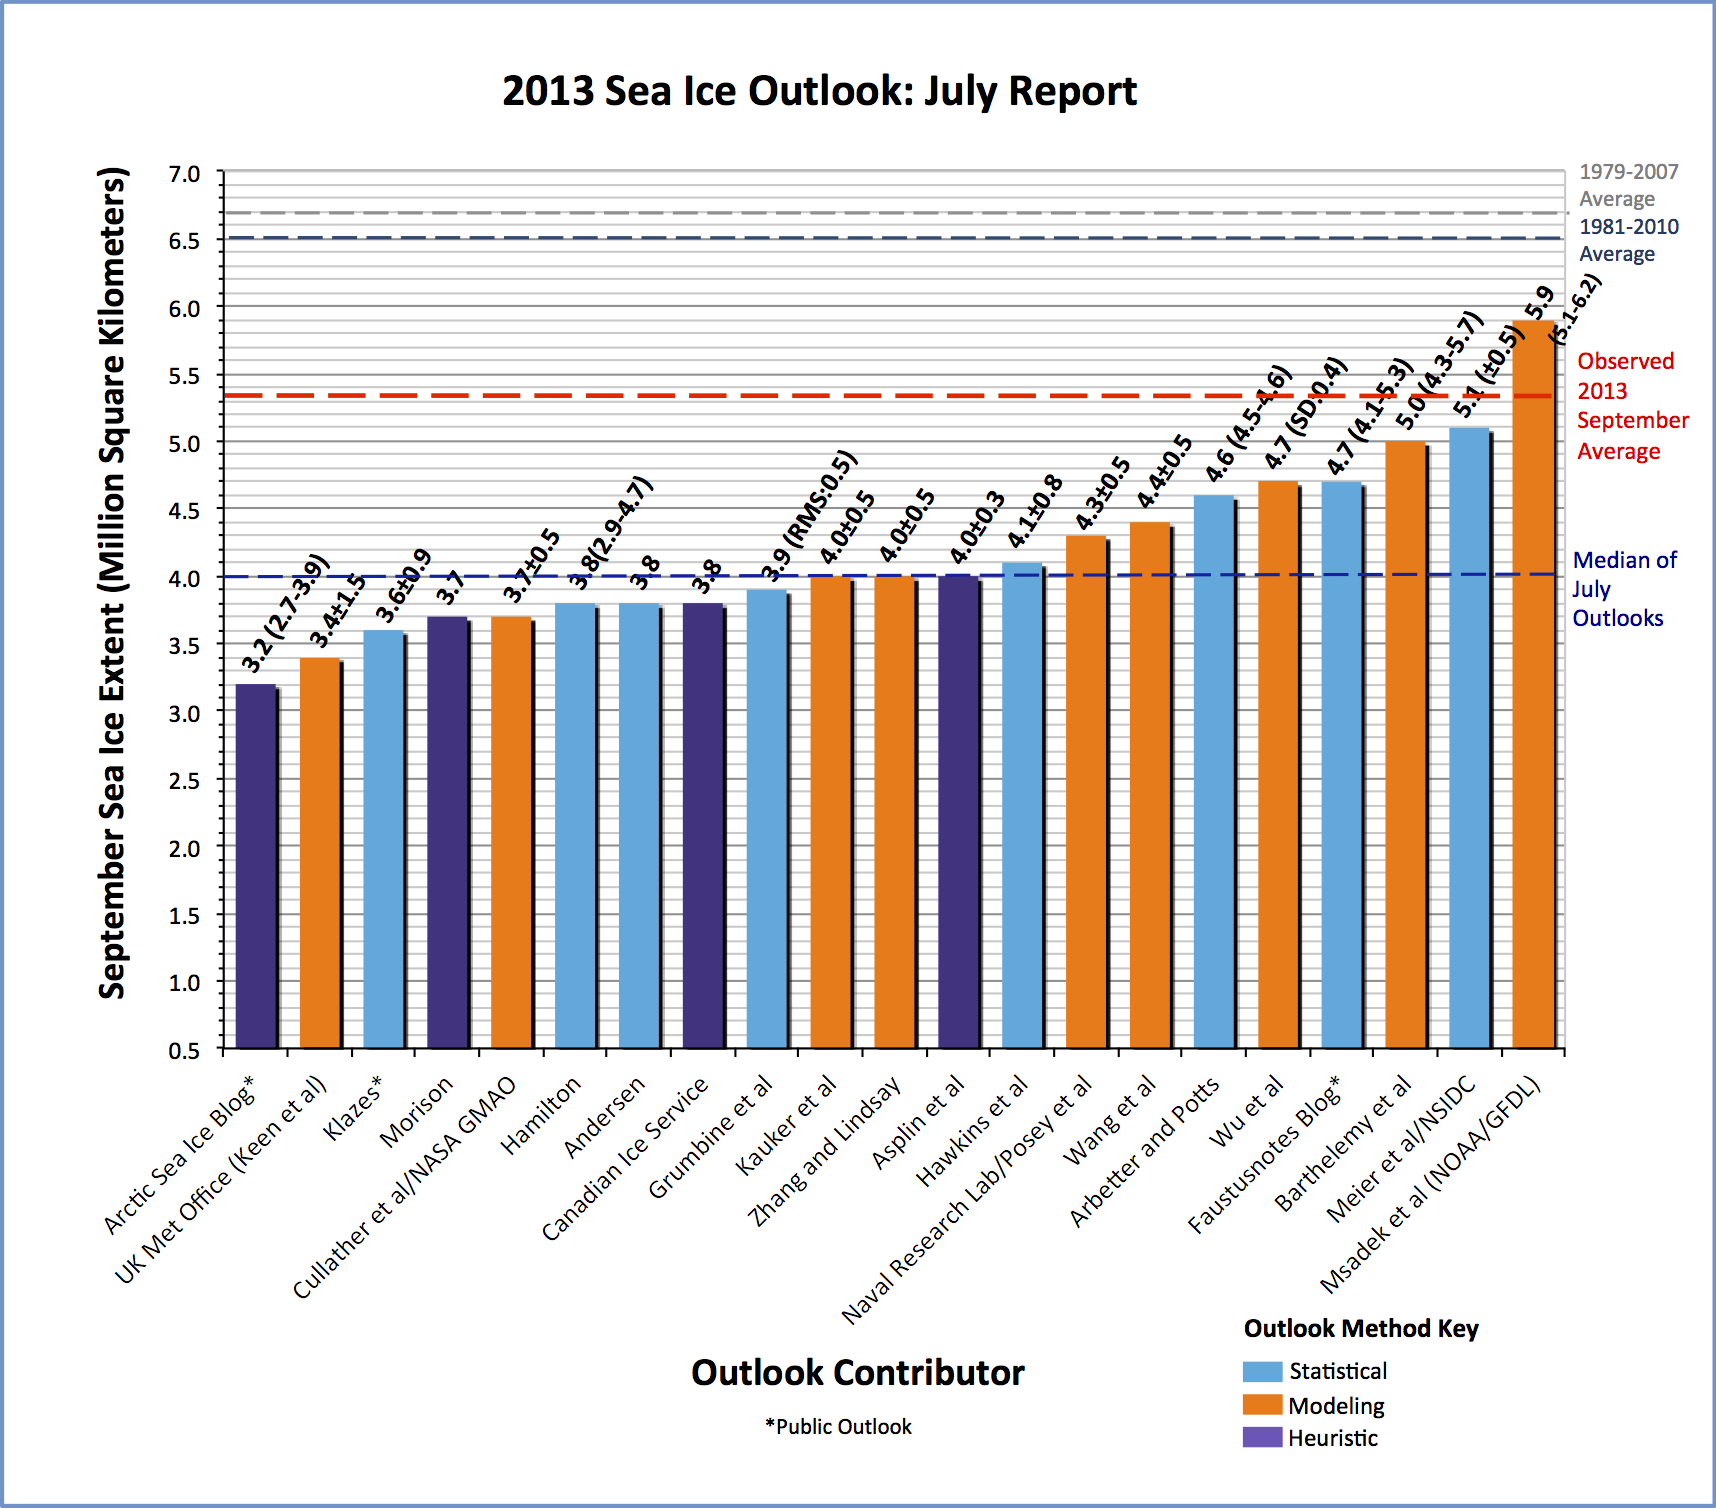
Contributor Outlook values for the June and July reports were lower (except one) than the observed September extent of 5.4 million square kilometers. Outlooks based on May data had a mean value of 4.1 million square kilometers; Outlooks based on June data had a mean value of 4.0 million square kilometers (Figures 4a & b).
.")
Download high resolution version of Figure 4a.
.")
Download high resolution version of Figure 4b.
Larry Hamilton (University of New Hampshire) has provided a summary plot for the 2013 Outlook and will provide a historical review in the future (Figure 5).
 of each group. The observed mean September 2013 extent, 5.35 million km2, is marked by a horizontal line. Median SIO predictions from all three methods shifted upwards in the August 1 cycle, reflecting adjustments to mid-summer conditions but also changing contributor pools. A more detailed analysis with comparisons to earlier years and other datasets has been drafted by Stroeve and Hamilton (in review), and will be summarized in a later post.")
This year we continued the effort to provide rapid-release ice thickness data through coordinated measurement campaign in March and April by NASA's IceBridge Team. The results of these flights and ancillary data were released in May for inclusion in seasonal ice prediction models.
A major lesson of the 2013 Sea Ice Outlook is the large interannual variability in sea ice extent introduced by regional meteorological variability, superimposed on a long term thinning trend. Thus we expect to see continuing low levels of sea ice extent with considerable interannual and regional variability.
Short excerpted statements from contributors to this final summary for 2013 are below, and the full individual contributions are available as PDFs at the bottom of this page.
Antoine Barthélemy, Université Catholique de Louvain: Our objective was to provide a simple contribution, based on an existing method but with a model which had not been used by past contributors. Our June report estimate was already close to the NSIDC value for the observed average September 2013 ice extent. According to our forced model, different atmospheric conditions can lead to very different minimum extents, even late in the melting season.
Richard I. Cullather et al, NASA GMAO: This year included the first contribution from the NASA GMAO. Preliminary results suggest a degree of seasonal predictability for conditions at high latitudes, which may be further exploited after some assessment and revision. See extensive review.
Canadian Ice Service: A single partial-recovery year in terms of summer sea ice extent has no implications on its own – it might simply be the result of interannual variability or noise about the longer term trend. However, the air-sea-ice system possibly retains some "memory" of ice conditions from year-to-year; this would mean that no record-breaking minimum will be likely in 2014 either. Also an extensive review.
We appreciate the time and contributions from all the participants that make the Outlook worthwhile, and to the SEARCH Program, ARCUS, and the NOAA Arctic Program of the Climate Program Office for support and guidance.
| Attachment | Size |
|---|---|
| Barthelemy et al.37.28 KB | 37.28 KB |
| Canadian Ice Service612.11 KB | 612.11 KB |
| Cullather et al.35.43 MB | 35.43 MB |
.")