By: Julienne Stroeve, NSIDC; Cecilia Bitz, U. Washington; Walt Meier, NSIDC; Edward Blanchard-Wrigglesworth, U. Washington; James Overland, NOAA/U. Washington; Muyin Wang, NOAA/U. Washington; Hajo Eicken, International Arctic Research Center; Lawrence Hamilton, U. New Hampshire; Jenny Hutchings, Oregon State U.; Helen Wiggins, ARCUS; Adrienne Tivy, National Research Council of Canada; Philip Jones, Los Alamos National Laboratory; and Elizabeth Hunke, Los Alamos National Laboratory
The Sea Ice Outlook (SIO), an activity of the Sea Ice Prediction Network (SIPN), provides an open forum for researchers and others to develop, share, and discuss seasonal Arctic sea ice predictions. The SIO produces reports in June, July, and August containing a variety of perspectives on Arctic sea ice—from observations of current conditions, to advanced numerical models, to qualitative perspectives from citizen scientists. A post-season report provides an in-depth analysis of factors driving sea ice extent in the summer and explores the scientific methods for predicting Arctic sea ice.
This article summarizes key highlights from the SIO 2017 Post-Season Report, which was released earlier this month. The report includes discussion of 2017 Arctic weather and ice conditions; the Outlook contributions and methodologies, including regional forecasts; and sea ice extent probability maps. The report also includes discussion of contributions for forecasts of the Antarctic maxima through the "SIPN South" project.
During the summer of 2017, the SIO received a total of 106 submissions of pan-Arctic September extent forecasts, which was a record number of contributions. Nine of the teams who submitted pan-Arctic forecasts also submitted full spatial fields of sea ice probability and three submitted full spatial fields of ice-free dates. Regional forecasts of the extent in the combined Chukchi, Bering, and Beaufort seas (the "Alaskan Region") were collected for a second year in a row.
Observed and Predicted Extent
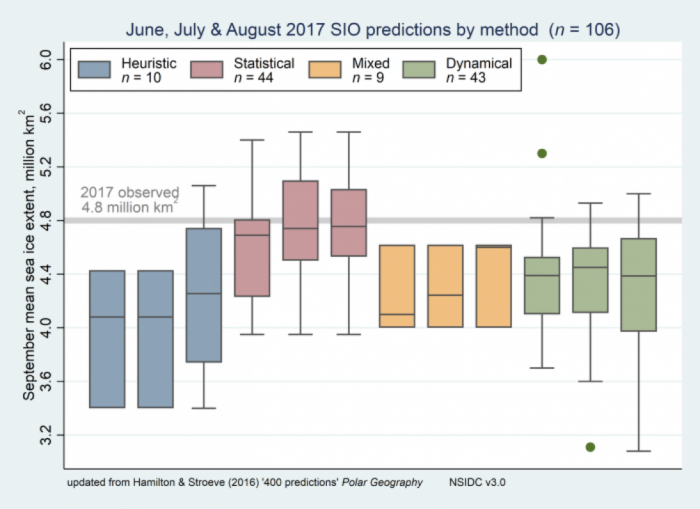
This year, the observed mean extent for the month of September was 4.80 million square kilometers with the new averaging method compared to 4.87 million square kilometers using the old method. This represents a September sea ice extent that was 1.6 million square kilometers below the average September extent for 1981–2010, but 1.23 million square kilometers above the record low in September 2012 and 300,000 square kilometers above that in 2016. The median Outlook across all methods was 4.43 million square kilometers in June, and 4.50 million square kilometers in July and August. Across all methods, the interquartile range in July and August just included the observations with the new averaging (4.2 to 4.8 million square kilometers), but it fell short in June (with an upper value at 4.71 million square kilometers). With the older averaging method, all forecasts interquartile ranges would have fallen outside the observed value. (Note: NSIDC changed their averaging method this year such that the monthly mean sea ice extent is now the average of all the daily sea ice extent values rather than the sea ice extent derived from the monthly average sea ice concentration. As a result, sea ice extents are slightly lower than before.)
Review of 2017 Sea Ice Outlooks

A total of 44 statistical forecasts, 43 dynamical, 10 heuristic, and 9 using mixed methods were received in 2017. Compared to other methods this year, the median and interquartile range of the Outlooks from statistical models better matched the observations than any other methods, including those based on dynamic models (i.e. coupled ice-ocean and ice-ocean-atmosphere models) (See Figure 1). This year's report contains significant discussion on the different Outlook prediction methods used.
Local-Scale Analysis
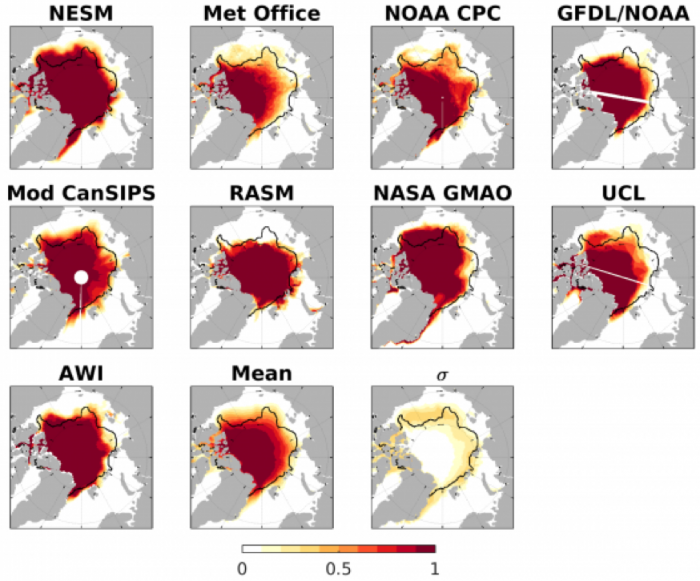
Since 2014, contributors have been invited to submit forecasts of sea-ice extent probability (SIP)—forecast probability of sea-ice concentration larger than 15%. This year a record number of SIP forecasts were received: 9 in June, 11 in July, and 6 in August. Figure 2 shows the SIP June Forecast, with the observed September sea-ice extent edge overlain, together with the ensemble mean of individual models' SIP, and the model uncertainty in the SIP forecast (as represented by the standard deviation across SIP forecasts). Overall, in 2017 models were more successful and consistent in their SIP forecasts along the "European" Arctic (Svalbard, Barents/Kara seas), and less so in the East Siberian/Beaufort seas. Interestingly, the observed sea ice edge lies almost entirely within the region of model uncertainty (bottom right panel), a positive result that indicates that overall the models are not consistently over-or-under predicting sea ice conditions.

Weather Patterns
The sea ice conditions this season were exceptional, with record low winter and spring sea ice extents through April. Warm weather conditions and thinner sea ice led to early formation of open water in the Chukchi Sea, the lowest observed in May. However, air temperatures in June through August were near or below the 1981 to 2010 average over much of the Arctic Ocean, especially on the Siberian side, which helped to slow overall ice loss and keep the ice edge near the climatological mean in the Barents and Kara seas. During October and November of 2017, anomalously low sea ice conditions were observed throughout the Arctic. However, conditions in autumn were most anomalous in the Chukchi Sea, where significant amounts of open water remained in November, leading to the lowest sea ice extent within the combined Bering and Chukchi seas at this time of year.
Antarctic Contributions
This year saw a record-low sea ice extent in September (17.83 million km² according to the NSIDC/NOAA G02135 product). In addition to contributing Arctic sea ice forecasts, 13 groups also submitted outlooks for Antarctic maxima sea ice extent. For all three Antarctic forecast exercises (June, July, August) the spread remained large, exceeding by far the range of the historical record. Notably, the predictions did not become more confident over time, as it has sometimes been noted for the Arctic. Analysis of the forecast spread was thwarted because only the total (circumpolar) monthly mean Antarctic sea ice extent was requested, so there was insufficient data to pinpoint the regions contributing to the total error and groups did not submit details about their forecast methodologies and information on whether bias corrections were included. A more dedicated coordinated experiment is scheduled for February 2018 in the framework of the SIPN South project. Further information about the SIPN South Project is available on the Scientific Committee on Antarctic Research (SCAR) Community News webpage.
The full SIO Post-Season Report is available through the SIPN website.
The original SIPN project grant has ended. The SIO and new activities will continue under Phase 2 of the Sea Ice Prediction Network project ("SIPN2"), which was recently funded by the National Science Foundation Arctic Sciences Section and the U.K. Natural Environment Research Council (NERC), with additional support and in-kind contributions by several organizations.
More information will be announced on the Sea Ice Prediction Network mailing list.
For questions, please contact Betsy Turner-Bogren via email at betsy [at] arcus.org.
Information about the authors is available on the SIPN Leadership webpage.
