By Chris A. Mattmann, PhD, Adjunct Associate Professor, Computer Science Department, University of Southern California.
The National Science Foundation (NSF) recently sponsored the "DataViz Hackathon for Polar CyberInsfrastructure," a workshop designed to build bridges between the polar research community and the cyberinfrastructure (CI) and data visualization communities. The workshop convened on 3-4 November 2014 at the Parsons New School for Design in New York City.

"DataViz"—also known as data visualization—is a set of tools that provide graphic communication of complex data. Effective data visualization of polar research data can support better information analysis, foster greater understanding of the spatial and temporal dynamics at play in polar regions, and promote new discoveries. Developing these tools requires communication and collaboration between researchers and the CI community.
The DataViz Hackathon brought polar scientists together with CI experts and data visualization experts, including data artists and early career researchers, to exploit the power of collaborative interaction. One workshop goal was to produce high impact novel code prototypes and data visualization tools and to recommend these CI technologies to the NSF Polar CI program. Releasing these prototypes will allow NSF to make longer-term investments in technologies and visualizations that can be adopted by the research community.
Other workshop goals were to:
- Create new polar datasets through a variety of approaches such as reformatting older American Standard Code for Information Interchange/Comma Separated Value (ASCII/CSV) files to modern JavaScript Object Notation (JSON);
- Geospatially locating datasets;
- Loading datasets into search tools and big data infrastructure;
- Design and evaluate new visualization approaches including D3.js, and TangeloHub; and
- Generate a final report summarizing workshop outcomes.

A total of 40 participants from 28 institutions including academia, private industry, government and non-governmental organizations participated in the meeting. Datasets were obtained in a variety of ways. Participants used CI to "crawl" data sets at NSF's Advanced Cooperative Arctic Data and Information System (ACADIS), NASA's Antarctic Master Directory (AMD) and the National Snow and Ice Data Center's (NSIDC) Arctic Data Explorer (ADE); and they brought their own data including station data from the University of Wisconsin Madison, and Open Geospatial Consortium (OGC) web services from Arizona State University.
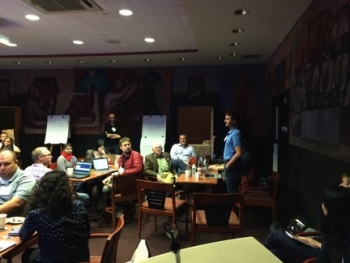
The meeting agenda was run in an "unconference" style. Workshop participants proposed all sessions and shaped the agenda prior to the meeting. During the workshop each of the 15 sessions began with the session proposers giving a "lightning talk" pitch that included a brief synopsis and statement of expected outcomes. Hackathon participants then identify their interests by writing their names next to session names. Workshop organizers used this information to allocate sessions running in parallel alongside of four "hacks" over the two days. Each hack was a one to two hour time-span of coding, preparing data, and creating visualizations. Data "artists" and visualization faculty from Parsons—the New School and the Parsons Institute for Information Mapping (PIIM) provided design guidance and feedback to the participants in selected sessions over the two-day period.
Some notable outcomes of the sessions included development of:
A data converting script and web service to covert Antarctic
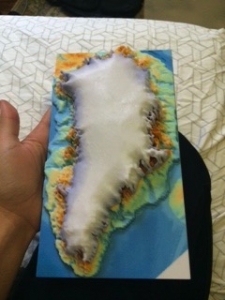
Meteorology Research Center (AMRC) Automatic Weather Station (AWS) data from simple text data to JSON data and then loading that data into Apache Solr ) to create an AWS Polar data search. More outcomes are described here;Code for 3-d printing of an Arctic bathymetry. More information about this session and its outcomes is available here; and
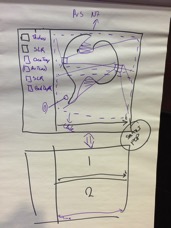
A visualization wire-frame for a 7th-8th grade oriented tool to allow comparison of sea live rise using two glaciers as an example. More information about this outcome is described here.


All of the contributions from the workshop sessions are stored in a public Github repository freely accessible and licensed under the Apache License, version 2 ("ALv2"). More information about the repository can be found here.
Workshop organization was led by Chris Mattmann, from the University of Southern California, and Parsons—the New School and the Parsons Institute for Information Mapping (PIIM). Amazon Web Services Inc. (AWS) provided cloud-computing resources. The meeting was hosted by PIIM Associate Director, Jihoon Kang and, Katie Wanner. Personnel from the Jet Propulsion Laboratory, California Institute of Technology (JPL) and the National Aeronautics and Space Administration (NASA) contributed to onsite logistics including creation of the website. Earth Science Information Partners Federation (ESIP) provided cross promotion and marketing. The full attribution and contributors list to the workshop can be found here and here.
For more information about the hackathon and its outcomes, please contact Chris Mattmann (chris.a.mattmann [at] nasa.gov). For more information about the NSF Polar CyberInfrastructure program, please contact MarcoTedesco (mtedesco [at] nsf.gov).
