POST-SEASON REPORT
HIGHLIGHTS & TAKE-HOME POINTS
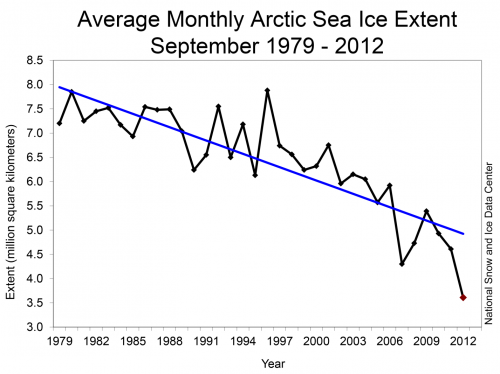
The average arctic sea ice monthly extent for September 2012 was the lowest observed in the satellite era at 3.6 million square kilometers, based on National Snow and Ice Data Center (NSIDC) estimates—50 % lower than the 1979-2000 average of 7.0 million square kilometers.
This value compares to the previous low value in 2007 at 4.3 million square kilometers and 4.6 million square kilometers in 2011.
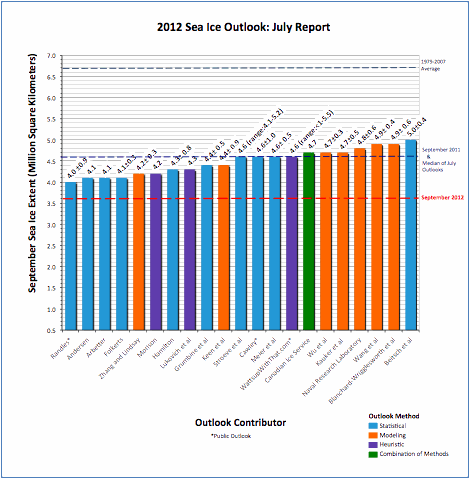
All individual Outlook estimates (20 groups total contributed) in the June and July reports were higher than the observed September arctic sea ice extent. June Outlooks (based on May data) had a median value of 4.4 million square kilometers; July Outlooks (based on June data) had a median value of 4.6 million square kilometers. However, of the 19 participants in the SIO June report, for example, 10 projected a September ice extent of 4.4 million square kilometers or less; thus, the majority of the participating groups were low relative to past years and thus were strongly in the right direction. Quartile ranges were narrow, at 0.4 and 0.5 million square kilometers, respectively.
Unlike 2007, which had a strong unusual wind pattern during all the summer months that contributed to major sea ice loss, summer 2012 meteorology was generally unremarkable, except for a strong storm in early August that contributed to sea ice breakup. Thus, although 2007 and 2012 were both record minimum years, there was a difference in their causes, with the record in 2012 primarily dependent on thin ice conditions. None of the Outlooks seem to have fully captured the importance of thin sea ice. Further review of conditions in 2012 will be an important contribution toward seasonal forecasting.
INTRODUCTION
We appreciate the ongoing contributions by all participants and reviewers in 2012. The SEARCH Sea Ice Outlook provides a forum for researchers to contribute their understanding of the state of arctic sea ice and for the community to jointly assess a range of factors that contribute to arctic summer sea ice minima. The Sea Ice Outlook is not a formal forecast, nor is it intended as a replacement for existing efforts or centers with operational responsibility. Additional background material about the Outlook effort can be found on the background page.
DISCUSSION AND LESSONS FROM 2012
The sea ice monthly extent for September 2012 was 3.6 million square kilometers, based on National Snow and Ice Data Center (NSIDC) estimates, a full 1.0 million square kilometers below the 2011 value (Figure 1). This is the lowest extent since the start of consistent satellite observations in 1979 followed by 2007 (at 4.3 million square kilometers) and was 50% below the 1979 to 2000 average. It should be noted that this NSIDC value is a monthly averaged estimate and it is dependent on a particular passive microwave algorithm for sea ice. We use the NSIDC value as an "operational definition," but other satellites, composites, or analyses will yield slightly different numbers. Sea ice extent in both 2012 and 2007 represent large reductions compared to the preceding year.

Image Source: http:/nsidc.org/arcticseaicenews/index.html
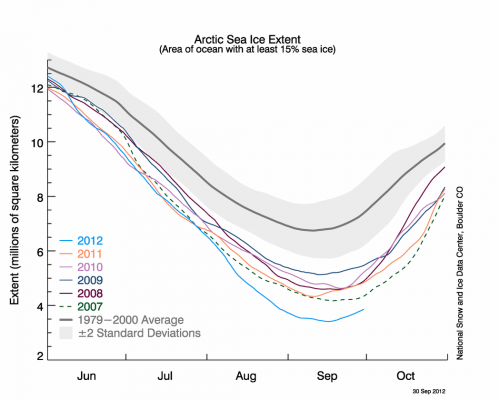
Seasonal sea ice retreat in 2012 began with a major reduction event in early June (Figure 2) associated with persistent high pressure over the Beaufort Sea and low pressure over the Kara Sea, now referred to as the Arctic Dipole (AD) weather pattern (see discussion of the AD in previous Outlooks). But unlike other years and especially 2007, the 2012 AD event did not persist well into the summer. The second reduction event occurred in early August and is attributed to a low pressure system centered over the Arctic, which supported breakup and the creation of openings between ice floes. These events made the ice pack vulnerable to accelerated melt, both through solar heating of open water and by melting of ice floes from warm ocean waters mixed into the sea ice field by the storm.

Image Source: http:/nsidc.org/arcticseaicenews/index.html
As excerpted from the 19 September NSIDC Arctic Sea Ice News & Analysis Report (http://nsidc.org/arcticseaicenews/2012/09/):
In contrast to 2007, when climatic conditions (winds, clouds, air temperatures) favored summer ice loss, this year’s conditions were not as extreme. Summer temperatures across the Arctic were warmer than average, but cooler than in 2007. The most notable event was a very strong storm centered over the central Arctic Ocean in early August. It is likely that the primary reason for the large loss of ice this summer is that the ice cover has continued to thin and become more dominated by seasonal ice. This thinner ice was more prone to be broken up and melted by weather events, such as the strong low pressure system just mentioned. The storm sped up the loss of the thin ice that appears to have been already on the verge of melting completely.
Contributor Outlook values for the June and July reports were all higher than the observed September extent of 3.6 million square kilometers. Outlooks based on May data had a mean value of 4.4 million square kilometers; Outlooks based on June data had a mean value of 4.6 million square kilometers (Figures 3a & b). Quartile ranges were narrow, with 0.4 and 0.5 million square kilometers, respectively.


Contributors to this final summary for 2012 are in qualitative agreement with NSIDC statement; short excerpted statements are below, and the full individual contributions are available as PDFs at the bottom of this page.
The Canadian Ice Service notes: The reduced overall sea ice thicknesses and the greater proportion of seasonal (first-year) ice were the primary reasons for this year’s record-breaking minimum. Multi-year ice never fully recovered after the 2007 minimum. Seasonal ice is also more susceptible to destruction by the winds and waves associated with summer storms passing over the Arctic Ocean.
The Center for Earth Observations Science notes: a decrease in sea ice concentrations throughout the Arctic pack and loss in ice thickness at the periphery of the ice pack indicated increased sensitivity of the ice cover to atmospheric forcing and attendant deformation and ridging.
Andersen notes: In the period 2007-2011 about 70% of the winter area disappeared. This could indicate that the extreme disappearance in 2007 triggered a new normal state. The consistency over five years indicates that this is not a purely statistical fluke. The question now is whether the near 75% disappearance in 2012 is a noise on the last year’s disappearance level or the start of stabilization at another level.
Arbetter notes: The summer was otherwise not remarkable in terms of surface air temperature. Long-term changes in atmospheric circulation have resulted in an increased amount of perennial sea ice being exported through Fram Strait rather than being recirculated (e.g., Beaufort Gyre); this was what set up the 2007 record September minimum. Much of the sea ice that formed in subsequent winters did not survive the following summer, either melting or continuing to be exported. Hence, the Arctic is transforming from a mainly perennial ice pack to a mainly seasonal ice pack. The storm in August 2012 broke up the existing (mostly seasonal) ice pack, spreading it apart into smaller floes and leading to an acceleration of sea ice loss.
This year, an effort was made to provide rapid-release ice thickness data through coordinated measurement campaign in March and April by NASA’s IceBridge Team, the SIZONet Arctic Observing Network project, the Naval Research Laboratory and industry (Fugro). The results of these flights and ancillary data were released in May for inclusion in seasonal ice prediction models. One of the studies utilizing this data set has just been published: Lindsay, R., C. Haas, S. Hendricks, P. Hunkeler, N. Kurtz, J. Paden, B. Panzer, J. Sonntag, J. Yungel, and J. Zhang (2012), Seasonal forecasts of Arctic sea ice initialized with observations of ice thickness, Geophys. Res. Lett., 39, L21502, doi:10.1029/2012GL053576.
A major lesson of the 2012 Sea Ice Outlook is that all contributors and those with objective methods underestimated the sea ice reduction, yet did note a continuing low level sea ice extent relative to previous years. They collectively conclude that recent September sea ice minima are more related to longer term shifts in thermal forcing and ice melt and thus persistence, and in most years, month-to-month meteorological variability over the summer months tends to cancel out extremes in atmospheric forcing. Thus we expect to see continuing low levels of sea ice extent. Long term trends now appear more important than short term weather events. Influences from the rate of melting, of thin ice, and loss of multi-year sea ice in 2012 were underestimated, even by objective methods. The information for a more extreme projection should have been available in data. A further quantitative review is warranted to improve the seasonal Outlook.
We appreciate the time and contributions from all the participants that make the Outlook worthwhile, and to the SEARCH Program, ARCUS, and the NOAA Arctic Program of the Climate Program Office for support and guidance.
| Attachment | Size |
|---|---|
| Andersen36.81 KB | 36.81 KB |
| Arbetter466.44 KB | 466.44 KB |
| Canadian Ice Service363.34 KB | 363.34 KB |
| Lukovich et al.51.51 KB | 51.51 KB |


