
On 12 September 2009, according to the National Snow and Ice Data Center (NSIDC), arctic sea ice reached its 2009 daily minimum extent at 5.1 million square kilometers. The September monthly average was 5.36 million square kilometers. {more from NSIDC website}
Weather in June and July was supportive of a major summer sea ice loss in 2009, but the weather in August and September changed completely from that of earlier in the summer, preventing extreme sea ice loss late in the summer. While no new record was set in 2009, the September 2009 sea ice extent was still much reduced compared to 1979–2000 mean conditions.

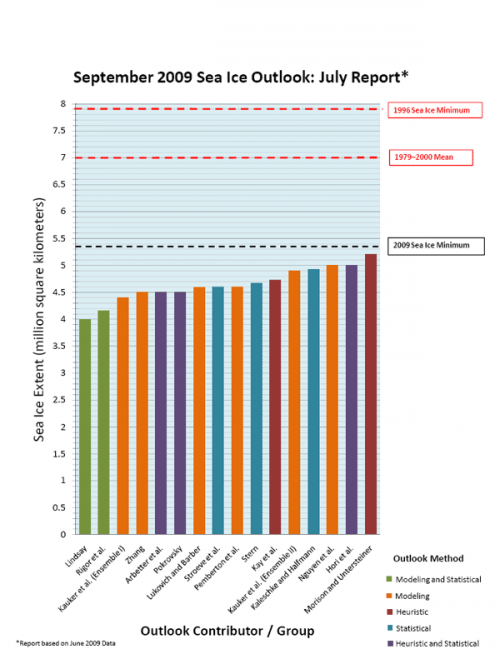
The chart below (Figure 2) shows the 2009 September monthly mean value as compared to the Sea Ice Outlook values from the July outlook report.
For more information and images related to the 2009 sea ice minimum, visit NSIDC's Sea Ice News & Analysis website.